Triple detection GPC/SEC combines measurements from multiple detectors to offer not only increased amounts of data, but also information, which is available thanks to the combination of different detectors and would not be obtainable using the individual detectors separately. The theory of triple detection GPC/SEC is described here.
Triple Detection GPC/SEC is a well-established technique for the accurate and complete characterization of macromolecules. The technique combines both light scattering and viscometer detectors with a refractive index (RI) detector and is applicable to both natural molecules, such as proteins or polysaccharides, and synthetic polymers.
The resulting molecular weight and structure information provides an invaluable tool for macromolecular researchers. This document will help the practitioner of triple detection GPC/SEC to understand the theory behind the detector technology and have a greater appreciation of the strengths and limitations.
The most common type of RI detector in use today is often called the deflection type. As the name suggests, it is based on the deflection of a beam of light as it passes through a dual compartment flow cell, as shown in Figure 1(a). The deflection of the beam is measured by two photodiodes in a differential circuit. One side of the cell compartment contains the reference solvent of refractive index n0, which is static during the measurement process. The other side contains the sample solution, i.e. the column eluent, having refractive index n. The beam is refracted at the liquid-glass interfaces that separate the two compartments and also at the liquid-glass interface on the exit wall, and again at the glass-air interface on the exit wall. A rigorous analysis must take each of the refractions into account. Fortunately, a simplified analysis that ignores the glass interfaces as shown in Figure 1(b) yields substantially the same result as the rigorous analysis, so that derivation will be reviewed instead.
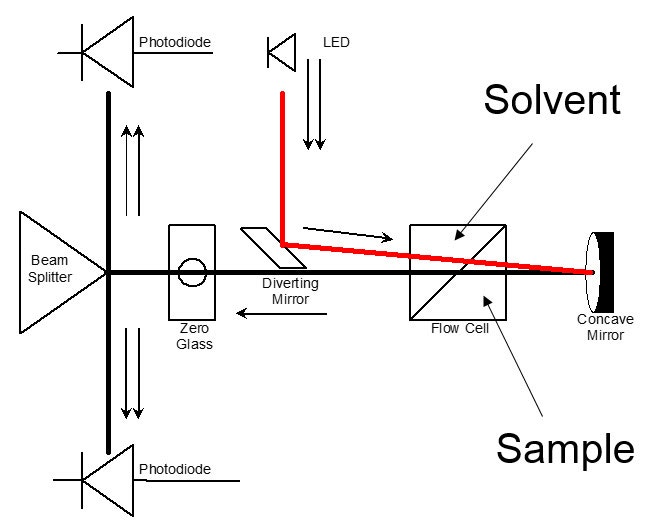
Figure 1: The deflection type refractometer
Snell’s law of refraction can be applied to the hypothetical liquid-liquid interface shown in Figure 1(b) to yield equation 1:

For the very small angles of deflection encountered here, we may approximate with no loss of accuracy as follows:

Combining equations 1 and 2 shows that the incremental refractive index is proportional to the deflection, x.

The differential signal will likewise be proportional to x because the beam, which actually has a finite width, will deliver more light to one photo-detector and less to the other as the beam is moved across the beam splitter due to refraction. Therefore we can combine instrument constants into one detector calibration factor. In addition, we can replace n by n0 because they are very nearly the same value at low concentrations.

Where ∂RI is the change in RI detector signal and RICal is the calibration constant for the RI detector.
If the RI detector is to be useful as a concentration detector, then the refractive index of the solution must be proportional to sample concentration - at least for dilute solutions. With batch RI analysis, where the sample compartment is not connected to the column eluent but is completely flushed with a solution of known concentration, one can test this assumption by plotting the measured signal against sample concentration.
This procedure is shown in Figure 2, where the RI signal is plotted against concentration for two different samples, polystyrene and polybutadiene, both dissolved in tetrahydrofuran (THF). It can be seen that each sample yields a straight-line slope, but the intercepts are not at zero for either sample and the slopes are different
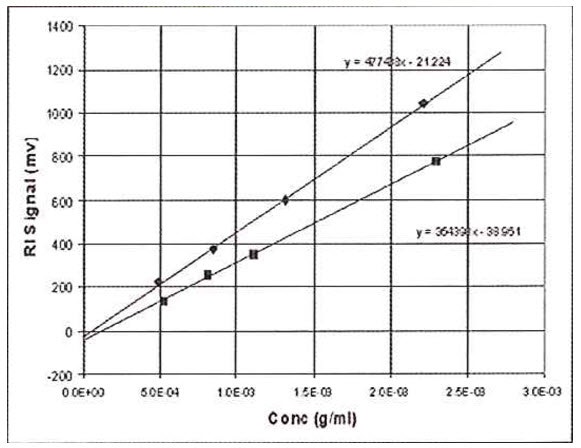
Figure 2: RI Data on polystyrene and butadiene using the batch method. Used for calibration or dn/dc determination
The reason the lines do not intercept at zero is because the reference side of the refractometer unintentionally contained a slightly different solvent to that used to make up the sample solutions. Typically, for a solvent such as THF, atmospheric contaminants such as water and air itself will tend to decrease the RI of the samples to a significant extent. It is impossible with a batch experiment to make sure that the reference side of the RI detector is purged with solvent that has the exact composition of atmospheric contaminants as the sample solutions, because the sample solutions continually absorb moisture and air during the course of the measurements. Therefore, we must be content to find a linear relationship between RI signal and concentration. The fact that the slopes of the polystyrene sample and polybutadiene sample are different means that the RI is not only proportional to concentration, but also to a sample-dependent parameter. This sample-dependent parameter is called the refractive index increment, or dn/dc. The general equation for the RI detector is therefore expressed as follows:

Therefore, dn/dc is the slope of a plot of refractive index against concentration. However, since the proportionality assumption requires the slope to be constant and the intercept equal to n0, the dn/dc is simply defined for a single solution of refractive index n and concentration C as follows:

Substitution of equation 6 into equation 5 yields equation 4 again.
In order to use the RI detector quantitatively, the calibration constant RICal must be determined. Figure 2 and equation 5 together provide a logical way to do this calibration. The slope of either of the plots in Figure 2 is a composite of three variables. If any two of the three variables are known, the other can be calculated from the measured slope.

If dn/dc and the refractive index of the solvent are known, then the calibration constant is calculated from equation 7. This can be applied to the polystyrene data in Figure 2, with dn/dc taken to be 0.185 g/mL and refractive index taken to be 1.405. The value of RICal calculates to be 3.63x10⁶. Using this value for RICal, the dn/dc of polybutadiene calculates to be 0.137 g/mL, which is slightly higher than the literature values, which range from 0.125 to 0.130 g/mL. We will see later where this error comes from.
The batch method is hardly convenient for the calibration or use of a chromatographic detector to calculate dn/dc. Columns must be removed and test solutions must be injected one by one, a laborious and tedious procedure. In addition, there is the atmospheric contamination problem, which can lead to a great deal of error if special care is not taken. It is much more convenient to inject the samples using an ordinary chromatography system with an auto-injector. Computer controlled data acquisition and processing then permits the calibration and calculations with a high degree of precision. It is necessary to reformulate the equations previously developed for this purpose.
Equation 5 can be restated as follows:

Here, RIi is the RI signal and Ci is the concentration, both at data interval i. The data intervals will be evenly spaced in time, ∂t, and therefore in elution volume data interval, ∂V.

Where Q is the flow rate in mL/min, ∂t is the time in seconds. The data interval is therefore in mL.
Suppose a sample of concentration Conc S and volume Vinj is injected onto the chromatography column. The RI response will follow equation 8 and is shown experimentally in Figure 3. Note that the atmospheric contaminants peak is resolved from the polymer. The area of the RI signal peak is computed as follows:

Substitution from equation 8 shows that the measured area of the RI peak is proportional to the area of the (derived) concentration peak.
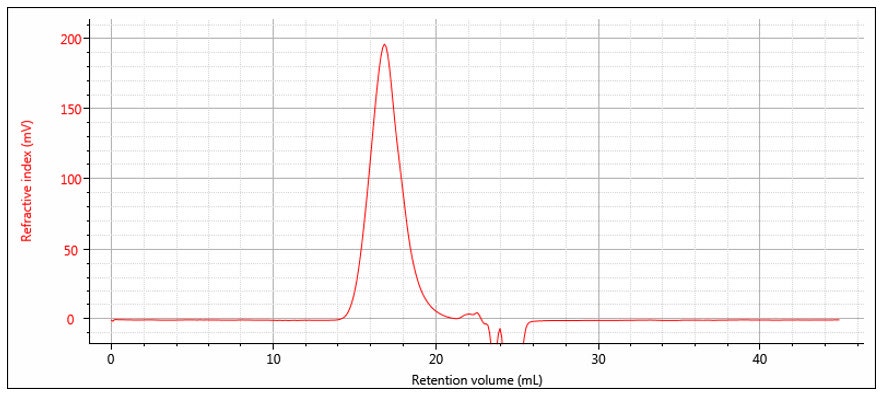
Figure 3: RI chromatogram
Equation 11 is derived with the assumption of conservation of mass, i.e. the entire mass of sample injected is recovered under the RI peak.

Furthermore, the concentration peak area must be equal to the total mass injected:

Insertion of equation 12 into equation 11 yields the following general expression for RI detector peaks:

Now it is possible to use chromatographic peak areas to calibrate and calculate dn/dc or sample concentration. The same polymer solutions used in the batch analysis of Figure 2 were injected onto a chromatographic column. The RI peak areas were measured and plotted against sample concentration in Figure 4. The slope of the plots is related to the calibration constant, dn/dc, etc. according to the derivative of equation 13.
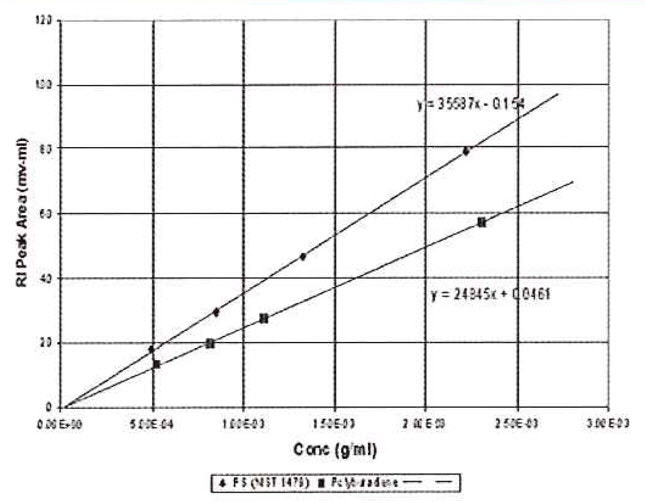
Figure 4: Chromatographic RI Data. Used for calibration or dn/dc determination.

Calculating the calibration constant from the polystyrene standard shows that RICal is equal to 3.60 x 10⁶, which is very close to that obtained by the batch method. The calculated dn/dc for the polybutadiene sample is 0.129 g/mL, which is closer to the expected value. The lines extrapolate very close to the origin because the atmospheric contaminants are removed from the peak. In addition, the precision of data fit is evidently better because this variable is removed.
The batch method of calibration is still sometimes used because it does not require the assumption of conservation of mass and it does not introduce the extra variables of injection volume and flow rate. However, it is implicit in the present context that the sample of interest is analyzed on a chromatography system whether or not the standard is at the same time. It is therefore impossible to avoid introducing the injection volume and flow rate variables. As a result, it is better to introduce them in the calibration process and in the dn/dc measurement process, so that any potential errors in these variables will tend to cancel out of the calculations. As far as the conservation of mass question is concerned, if there is a concern about possible absorption on the columns, the peak calibration method can be performed with columns removed. The atmospheric contamination will still interfere, as in the batch analysis, so the precision will be poorer than with column chromatography. Nevertheless, it provides a way of testing whether the standard is being absorbed. In summary, the RI detector should be calibrated by the batch method if it is to be used in the batch mode, but by the chromatographic method if it is to be used in the chromatographic mode.
Other concentration detectors such as UV (ultraviolet) or IR (infra-red) absorbance detectors and EMD (evaporative mass detector) can be used as the concentration detector - at least in principle. These detectors can sometimes provide better baseline stability and higher sensitivity than the RI. However, the ability to measure dn/dc of the sample is lost. This ability is critical for wide-ranging applications where dn/dc may change from sample-to-sample and it is also critical if a light scattering detector is to be employed in the system. Furthermore, the EMD provides a response that is non-linear with sample concentration, although it may be possible to use a linearity correction method to alleviate this problem. However, the EMD response is also dependent on molecular weight, which is a serious, quantitative flaw that effectively prevents it from being used as a concentration detector for GPC/SEC unless the samples cover a very narrow range of molecular weight. The IR and UV absorbance detectors have selective responses depending on chemical structure. That feature makes them most useful when used in tandem with the RI detector to resolve blends and co-polymers.
The advantages of using a light scattering (LS) detector in GPC/SEC are well documented, but in summary the LS detector allows the direct measurement of the sample molecular weight without recourse to calibration of the elution volume of the columns with a series of standards (conventional calibration). There are three types of LS detectors commercially available, right-angle light scattering (RALS, measuring at 90°), low-angle light scattering (LALS, measuring at <10°) and multi-angle light scattering (MALS, measuring at 2 or more angles typically 20-160°). The difference in these systems and their performance for different applications is covered comprehensively in the white paper “Static light scattering technologies for GPC/SEC explained” available on the Malvern website (Ref. 7). Here, we will focus on LALS, the most fundamental light scattering technique, that avoids some of the estimations and assumptions of RALS or MALS. However, the principles of the triple detection calculations, once molecular weight is determined at each data slice by RALS, MALS or LALS, is identical. The only difference is in the accuracy of the molecular weight value depending on its origin.
The fundamental equation for the scattering of light from dilute polymer solutions is the Zimm equation:

Mw is the weight-average molecular weight of the polymer sample and C is the sample concentration. A2 is the second virial coefficient of the solution, which corrects for the interaction of polymer molecules with each other. A2 may be calculated from the concentration dependence of the light scattering signal. Rθ is the excess Rayleigh scattering ratio of the solution above that of the pure solvent, measured at angle θ with respect to the incident laser beam and can be expressed as follows:

Where I0 is the irradiance of the incident laser and Iθ is the excess intensity of the scattered light above that of the pure solvent at angle θ (which can be obtained from the baseline-corrected LALS signal). A schematic of the optical arrangement of the LALS, which measures the scattered light at 7° to the incident laser beam, is shown in Figure 5. k is an instrument constant related to the scattered light collection efficiency. Pθ is the particle scattering factor, which is a measure of the angular dissymmetry of the scattered light and is related to the size and the angle at which the scattering is determined. Much of light scattering science is devoted to the determination of, or correction for, Pθ but the huge advantage of using LALS is that Pθ can be ignored.
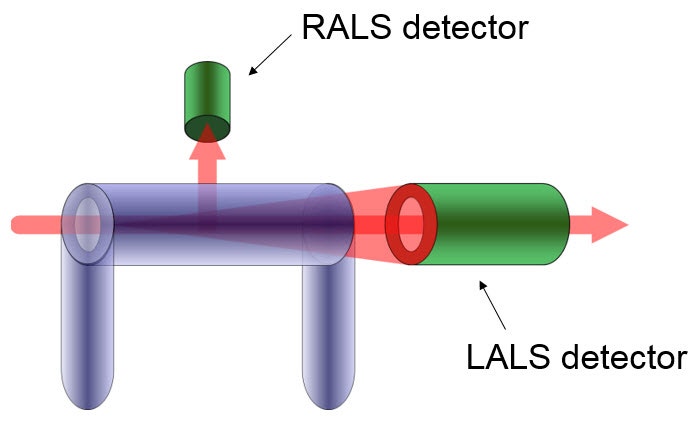
Figure 5: Schematic of LALS detector
Pθ is exactly equal to unity for all molecules when θ is zero.
Pθ is 0.98 for molecules with radius of gyration (RG) of 150 nm when θ is 7 degrees.
RG of 150 nm constitutes the upper limit of separation of GPC.
Therefore, with LALS, multi-angle measurements are unnecessary because extrapolation or correction for angular dissymmetry is unnecessary. This reduction to a single angle greatly simplifies the processing of data from multiple detectors.
K is a composite of optical and fundamental constants.

Where n0 is the refractive index of the solvent, ν is the refractive index increment of the polymer solution (often referred to as dn/dc), NA is Avogadro’s number, λ0 is the wavelength of the incident light in vacuum and p is an integer equal to 2 for vertically polarized incident light (1 for un-polarized).
The latter three parameters (NA, λ0 and p) are instrument constants and can be merged with the detector constants k and I0 in equation 16 to form a new constant which we will call LalsCal. Equation 15 can now be rearranged to separate the variables of molecular weight and concentration from the other parameters.

At normal GPC/SEC concentrations the second virial coefficient A2 is typically insignificant compared to the first term in the denominator, so equation 18 can be simplified by neglecting the A2 term, although there is provision in most good GPC/SEC light scattering software packages to allow a value to be entered.

Equation 18 is the general equation but equation 19 will be used in the present discussion for purposes of simplification.
The elution profile consists of successive fractions of the eluent sampled at equally spaced time intervals, i. Each fraction will be characterized by its molecular weight Mi and concentration Ci. The term Ci is determined from equation 8 in Part 1 as follows:

RIi is the signal from the RI detector at interval i and RICal is the detector calibration constant. Substituting equation 20 into equation 19 yields the elution profile of molecular weight.

Note that the array index for the LALS signal is offset from that of the RI detector by an amount δ. This detector offset reflects the fact that the two detectors do not measure each fraction simultaneously. They have a time (volume) separation between them related to the volumes of the two detectors plus the volume of the interconnecting tubing. Equation 21 reveals that molecular weight elution profile is proportional to the ratio of the LALS detector signal to the RI detector signal.
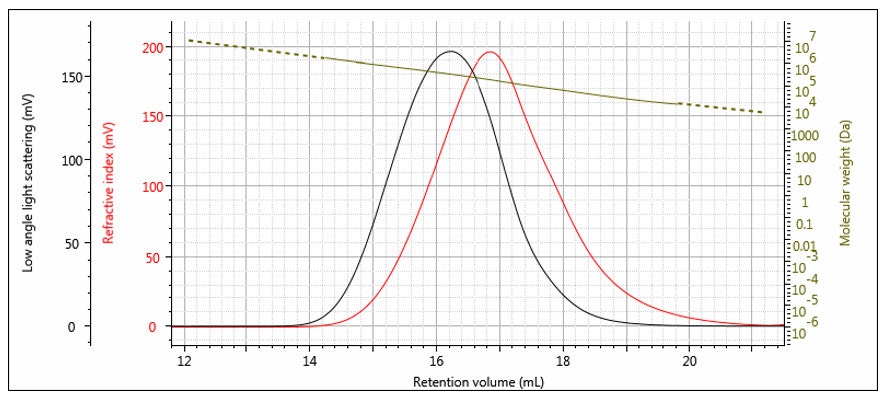
Figure 6: Log M elution profile overlaid with RI and LALS chromatograms for a broad distribution polystyrene sample.
An elution profile for molecular weight on a broad distribution polystyrene sample is shown in Figure 6, overlaid with the RI and LALS signals. It is worth noting that that Mi profile may often have more noise at each end than in the middle. This is due to the RI and LALS signals being lower in magnitude at the extremes of the peaks, so the noise is relatively higher. Once the noise becomes significant compared to the signal, the calculation must be truncated at some point and Mi is obtained for the rest of the distribution by extrapolation. The extrapolation is shown in Figure 6 as the dashed line.
Light scattering detectors and the molecular weights they produce are often called ‘absolute’. However, all light scattering detectors (RALS, MALS or LALS) without exception require one or more instrument constants to be determined. These constants are required to relate the signal to molecular weight. Some choose to do this calibration by the use of a pure solvent (e.g. toluene), but most practitioners use a polymer standard, particularly given that it is required for many other calibration parameters (e.g. RI calibration, band broadening).
The instrument constants RICal, LalsCal and δ are determined from the chromatograms of a narrow distribution polymer standard — for example a narrow polystyrene standard as shown in Figure 7. The offset δ can be determined from the difference in the peak positions, although it is worth noting that it is not just a simple volume difference and the band broadening is also calculated at the same time. Figure 8 shows the same chromatograms after the offset is applied. The RI calibration constant is determined from the RI peak area and dn/dc as shown previously in Part 1. The LALS calibration constant is determined from the LALS peak area, which is directly proportional to the weight-average molecular weight as shown in the next section.
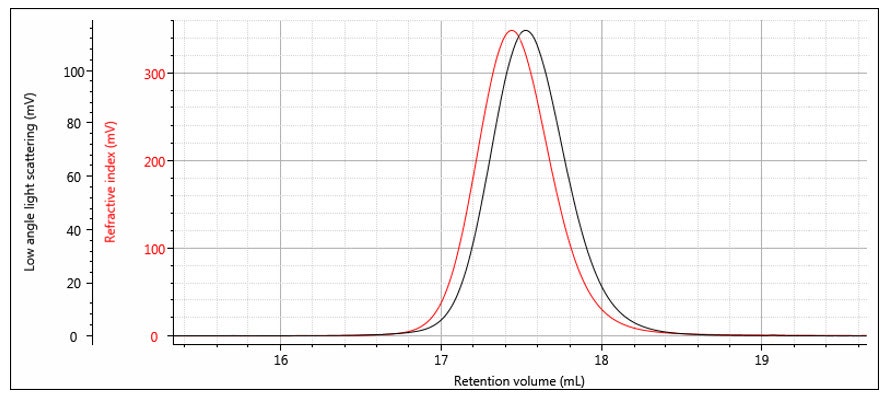
Figure 7: RI and LALS chromatograms of a narrow distribution polystyrene standard
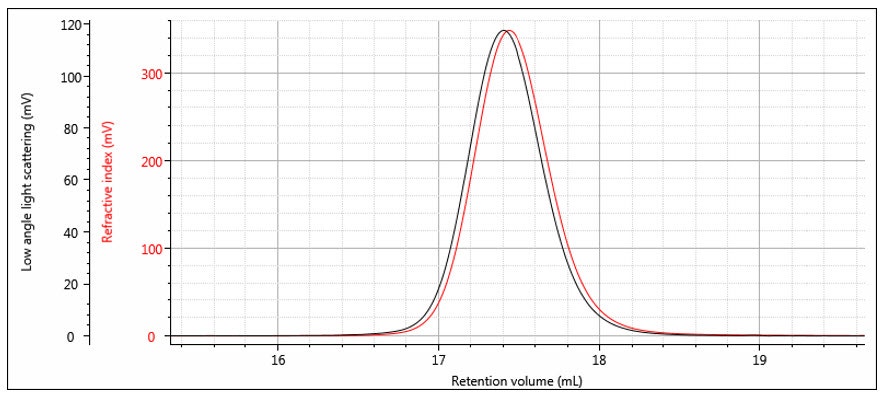
Figure 8: RI and LALS chromatograms of a narrow distribution polystyrene standard with detector offset and band broadening applied
The molecular weight distribution can be represented in several ways — the most important being the number-average molecular weight MN and the weight average molecular weight MW. MN is defined as the average molecular weight (molar mass) over the successive fractions of the sample, with the statistical weight of each fraction being the number of molecules, or molar concentration Ni. The molar concentration is simply the ratio of the weight concentration Ci and molar mass Mi, which are determined by equations 20 and 21, respectively.

The number-average molecular weight is therefore defined as follows:

The weight-average molecular weight is defined as the average molecular weight (molar mass) over the successive fractions of the sample, with the statistical weight of each fraction being the mass of molecules, or weight concentration, Ci.

The summations in equations 23 and 24 are directly related to peak areas in the GPC chromatogram. The sum of Ci is proportional to the area of the RI detector peak, per equation 20.

The sum of CiMi is proportional to the area of the LALS detector peak, per equation 19.

Combining equations 24 – 26 reveals a very simple relationship between MW and the chromatographic peak areas.

The sum of Ci/Mi is proportional to the area of the molar concentration peak, per equation 22. So MN can also be considered a ratio of peak areas as follows:

However, molar concentration is a derived function, not a detector signal, so MN does not have the same type of simple relationship to detector peak areas as does MW. The derivation of molar concentration often results in greater error for determination of MN than for MW. This is because MW can be determined very precisely because it is simply proportional to the ratio of the LALS and RI peak areas, both of which have excellent signal/noise. MN is determined by the peak area of molar concentration, which will have more noise on the long elution volume side of the peak. This noise is inherent in a broad distribution sample and arises from the fact that molar concentrations are higher where the molar mass (and therefore the light scattering signal) is lower. MN will therefore be determined by light scattering with less precision than MW where the distribution is broad. Narrow distribution samples will not exhibit this problem.
In summary, the LALS detector provides sensitive, simple and accurate molecular weight measurement for GPC/SEC. By measuring directly at a very low angle it avoids the complexity, assumptions and errors inherent in angular correction.
Intrinsic viscosity is a measure of the molecular density of a polymer molecule. A low intrinsic viscosity represents a compact, dense molecule, while a high intrinsic viscosity represents a larger more open molecular structure. The structure of a molecule at a given molecular weight will affect that molecule’s contribution to the viscosity of the solution by a given amount, assuming no interaction between it and other molecules. Measurement of solution viscosity as sample concentration changes at low concentrations is then a way to calculate the intrinsic viscosity of a sample.
The viscometer achieves this by measuring the viscosity of the sample solution at concentrations assumed to be low enough to avoid interaction between the sample molecules.
The most common viscometer design is the 4-capillary bridge design invented by Haney (Ref. 1). Four capillary tubes R1–R4 with internal diameters of approximately 0.25 mm are arranged in a balanced bridge configuration, analogous to the Wheatstone bridge common in electrical circuits (Figure 9). Differential pressure transducers measure the pressure difference DP (differential pressure) across the midpoint of the bridge and the pressure difference IP (inlet pressure) from inlet to outlet. A delay volume is inserted in the circuit before capillary R4, in order to provide a reference flow of solvent through R4 during elution of the polymer sample. The requirements of the delay volume are:
It must have internal volume larger than the net elution volume of the GPC column.
The flow resistance must be negligible compared to the capillary resistances.
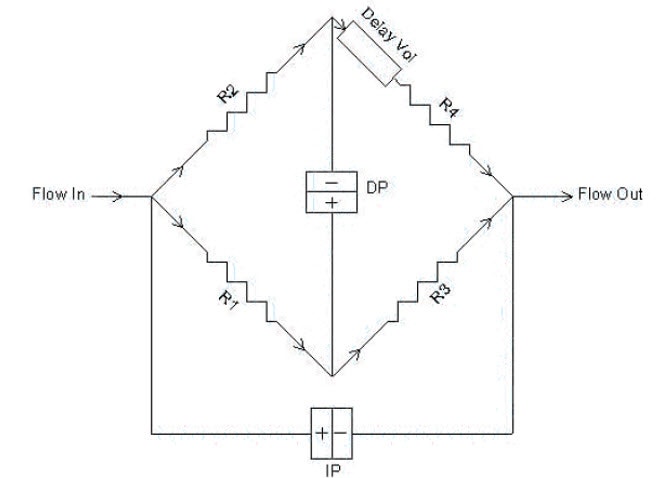
Figure 9: Schematic diagram of Differential Viscometer
The capillary tubes are chosen so that the flow resistances are as equal as possible. In this case, the DP output signal will be nearly zero and most of the pump pulsations will be cancelled out in the differential bridge measurement. DP will respond to the viscosity of the sample as it elutes from the GPC, as shown in Figure 10. The first peak corresponds to the sample as it elutes into capillaries R1, R2 and R3, while solvent flows through capillary R4. The second, negative peak is the breakthrough in the delay volume. At this point in time, R4 contains the sample and R1, R2 and R3 contain solvent. The breakthrough peak is not required for the calculation and is simply an artefact of the measurement. The position of this artefact peak can be simply controlled by the size of the delay volume and the length of the analytical run so that it does not interfere with the analytical peak and is fully eluted before the next sample.
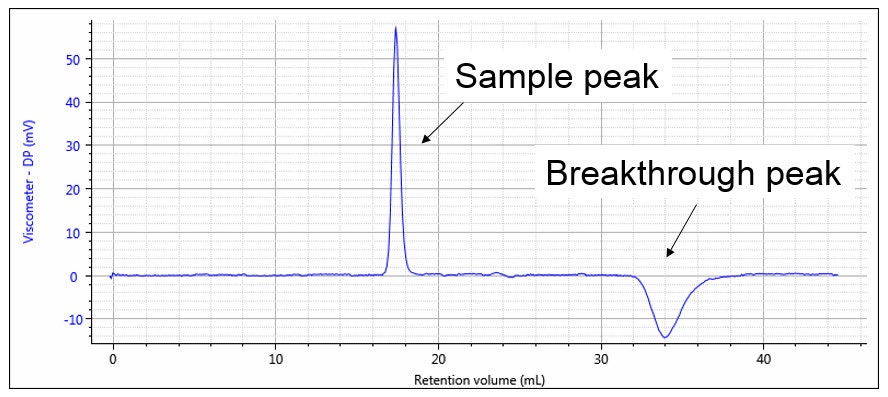
Figure 10: Viscometer response, showing sample and breakthrough peaks
Poiseuille’s Law of flow through a tube relates the pressure drop P to the flow rate Q, the viscosity η and the resistivity R of the tube:

Referring to Figure 9, the DP signal is equal to the difference between the pressure drop across R3 and the pressure drop across R4 + Delay. During the elution of sample the following equation expresses DP in terms of Poiseuille’s Law.

Q+ is the flow rate through the positive flow circuit, Q– is the flow rate through the negative flow circuit, η is the viscosity of the sample-containing solution, and η0 is the viscosity of the solvent. Likewise, if R3= R1, IP can be expressed as follows:

Dividing equation 30 by equation 31 yields:

The ratio of flow rates through the parallel flow circuits can be calculated in terms of the relative resistances of each circuit.

At this point we apply the assumption that the capillary tube resistances are equal.

Then equations 32 and 33 combine to give the following expression relating viscosity of sample η and viscosity of solvent η0.

The specific viscosity of the solution is defined as:

Insertion of this definition into equation 35 yields the basic equation of the differential viscometer:

The differential viscometer detector permits the accurate and sensitive calculation of specific viscosity of the eluting polymer sample. However, the function of primary interest is the intrinsic viscosity, which is defined as the ratio of specific viscosity to concentration in infinitely dilute solution.

Classically the intrinsic viscosity is determined by extrapolation of the ratio ηsp/C through various concentrations to zero concentration. This is impractical for chromatographic detection and it also turns out to be unnecessary. For the very low concentrations in the range where GPC is practical, the single point estimation of intrinsic viscosity due to Solomon and Ciuta (Ref. 2) is sufficiently accurate.

In section 1 of this paper, it was shown how the refractive index detector allows the calculation of the concentration profile across the chromatogram, Ci. In section 2, it was shown how adding the light scattering detector to the RI detector allows the calculation of the molecular weight profile across the chromatogram. Equation 37 yields the specific viscosity profile, ηsp,i. The intrinsic viscosity profile can then be calculated as follows:

The specific viscosity profile is offset by an amount σ, corresponding to the offset of the viscometer detector relative to the RI detector. This is corrected for during the calibration process. The weight-average intrinsic viscosity is of particular importance because it corresponds to the bulk intrinsic viscosity of the sample i.e., that which would be measured in a conventional glass tube viscometer. This is proven by the following derivation:

The earliest use of the viscometer detector was for Universal Calibration (Ref. 3), a column calibration method of determining molecular weight distribution that does not require the standards and samples to have identical structures. Universal Calibration still has utility in certain applications, particularly with samples having low molecular weights and/or low values of dn/dc. However, for the majority of polymers, light scattering is preferred for determining molecular weight and the increasing sensitivity of light scattering detectors is further reducing the requirement for universal calibration. The viscometer detector is still very useful for measuring other polymer properties; particularly those related to size or structure, hence the popularity of the triple detector system. Two triple detector application areas will now be discussed: The measurement of hydrodynamic radius, Rh and the measurement of polymer structure and branching.
Einstein (Ref 4) showed that the viscosity of a solution is related to the hydrodynamic radius of the particles in the solution.

Where φ is the volume fraction of particles in the total volume of the suspension. By converting φ to concentration units, it can be shown that equation 42 actually relates the intrinsic viscosity, molecular weight and hydrodynamic radius as follows (Ref. 5):

The triple detector SEC measures [η] and M absolutely7, so Rh is thereby absolutely derived. This measurement is useful for polymers, where the distribution of Rh can be determined. In Figure 11 the measured Rh is overlaid with the weight fraction distribution. It can be seen that the Rh distribution is measurable, with good precision over the entire distribution of this polymer sample. Rh measurement is especially useful for proteins, as shown in Figure 12, where the Rh can be computed accurately for the dimer and trimer, as well as the monomer unit.
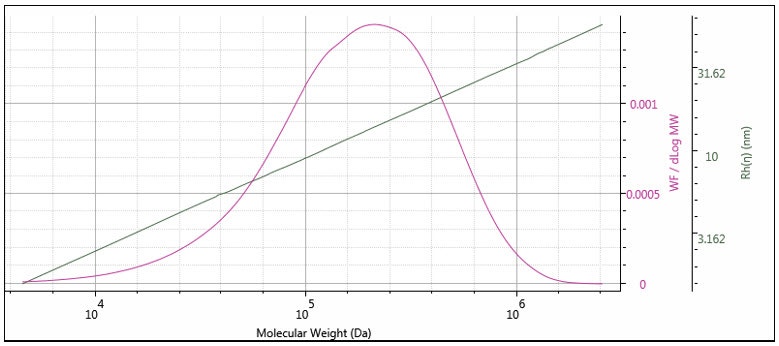
Figure 11: Hydrodynamic radius distribution of a polystyrene standard
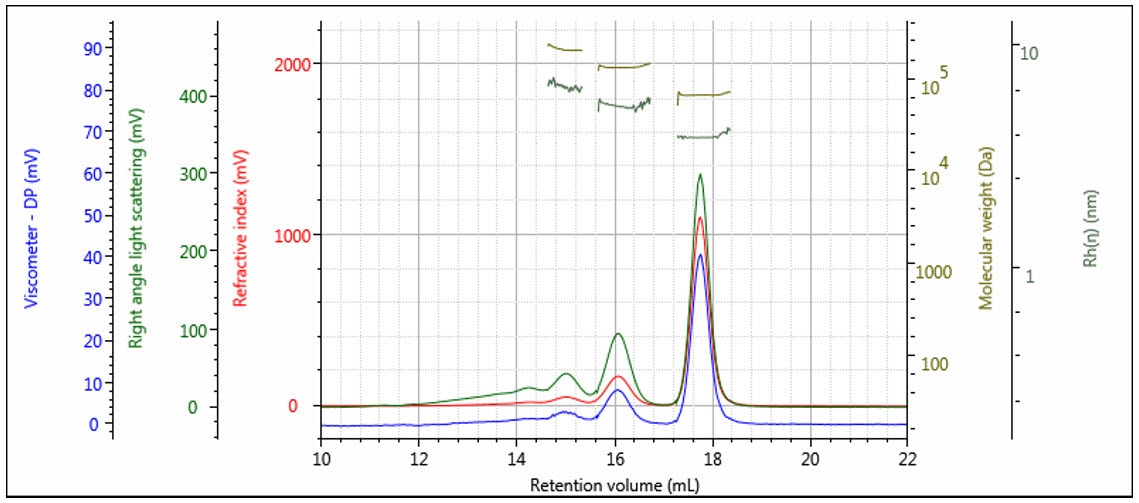
Figure 12: Triple chromatogram of a protein showing molecular weight and Rh calculated for each oligomeric form
As mentioned above, the triple detection system measures [η] and M absolutely7, so that it is simple to construct a very accurate double logarithmic plot of molecular weight, M versus intrinsic viscosity, [η]. This is generally called a Mark-Houwink plot and is the single most useful tool for polymer scientists that can be generated from multi-detection GPC/SEC. Figure 13 shows a typical example of a Mark-Houwink plot.
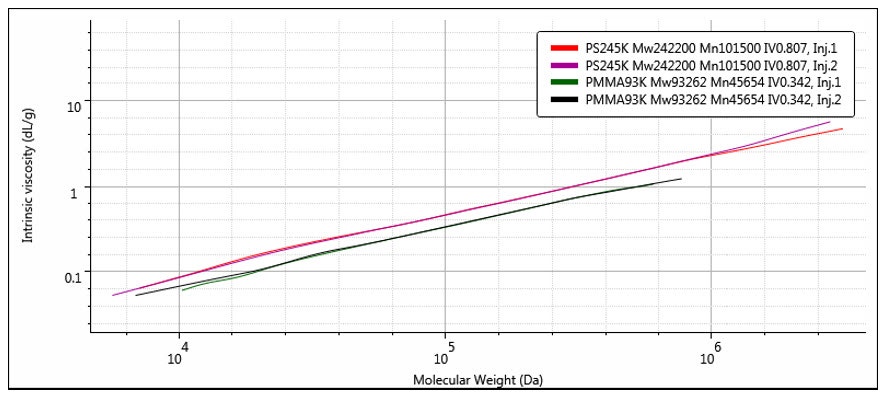
Figure 13: Mark-Houwink plot comparing the structures of two polydisperse polystyrene (red & purple) and PMMA (black & green) samples.
The general relationship of the Mark-Houwink plot can be expressed as follows:

Where the intercept value, K, is related to the backbone structure and the slope, a, describes the density of the polymer. An open, random coil polymer will have a larger value of a compared to a more compact, for example branched, structure. You can see this difference in Figure 13, where the polystyrene sample shows a higher a value than the PMMA sample. It is also clear that the a value can vary with molecular weight as the structure changes. This ability to compare the relative structures of different polymers run under the same chromatographic conditions makes the Mark-Houwink plot a better method of comparison compared to molecular weight distributions alone.
Going beyond the relative comparison of structures with the Mark-Houwink plot, a quantitative estimate of the number of branches in a polymer structure can be made. Intrinsic viscosity is related to the degree of long chain branching in polymers through the following factor (Ref. 6):

[η]M,brdenotes the intrinsic viscosity of the branched polymer at molecular weight M, and [η]M,linis the intrinsic viscosity of the corresponding linear polymer at the same molecular weight M. ε is a structure factor.
With this information, calculation of the number of branches and branching frequency of a sample is possible using the Zimm-Stockmayer equations.
In this white paper, we have seen how triple detection combines measurements from multiple detectors to offer not only increased amounts of data, but also information, which is available thanks to the combination of different detectors and would not be obtainable using the individual detectors separately.
The RI detector measures an accurate concentration profile while the light scattering gives absolute molecular weight independent of any column calibration standards. The viscometer provides the all-important structural data, allowing GPC/SEC to be used to determine such parameters as branching in polymers or hydrodynamic size differences in proteins. No single or dual detector combination can so easily measure these important parameters — the power of triple detection lies in the combination of complementary information provided by all three detectors.
1. Haney MA (1985); American Laboratory. 17(4): 116–126.
2. Solomon OF & Ciuta IZ (1962); J. Appl. Polymer Sci. 6: 683.
3. Styring M, Armonas JE & Hamielec AE (1986); J. Liquid Chrom. 9: 783–814.
4. Tanford C (1961); ‘Physical Chemistry of Macromolecules’ John Wiley & Sons, NY. p334.
5. Tanford, ibid, p391.
6. ‘Characterization of Long-Chain Branching in Polymers’. Chapter 1 in Developments in Polymer Characterization – 4. Dawkins JV, ed. Applied Science, Barking, (1983).
7. "Static light scattering technologies for GPC/SEC explained", Malvern Instruments white paper, www.malvern.com/slsexplained