Multiple scattering refers to the phenomenon where photons scattered from the sample are re-scattered from neighboring particles prior to reaching the instrument detector.
In dynamic light scattering, the correlation or “non-randomness” of the scattered photons is measured across very small time scales. Multiple scattering will increase the randomness of the scattering signal, thereby decreasing the correlation and making the particles appear to be moving much faster than they really are. The net result is that DLS size measurements in the presence of multiple scattering will be biased toward smaller sizes. It is for this reason, that instruments which measure at the center of the cell require the samples to be dilute.
Symptoms of the presence of multiple scattering in a DLS measurement are:
(1) a decrease in the measured intercept (amplitude) of the correlation function at higher concentrations.
(2) a decrease in the apparent size of the sample at higher concentrations.
(3) an increase in the apparent polydispersity of the distribution at higher concentrations.
Figure 1 shows the concentration dependence of the measured intercept (amplitude) of the correlation function and the hydrodynamic size of a 200nm polystyrene latex standard, measured in the center of the sample cell with a Malvern Zetasizer Nano system. As the sample concentration is increased, both the intercept and the apparent Z average size are decreased, indicative of the effects of multiple scattering.
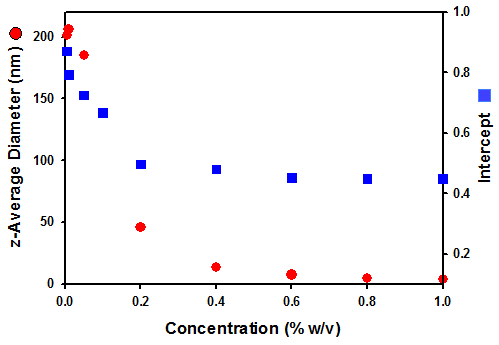
Figure 1:Sample concentration dependence of the "apparent" z-average diameter (in nm) and correlation function intercept of a 200nm polystyrene latex standard, measured in the center of the sample cell with a Zetasizer Nano system.
The effect of multiple scattering on the apparent distribution polydispersity can be seen in Figure 2, which indicates a distinct increase in the width of the distribution as the sample concentration is increased.
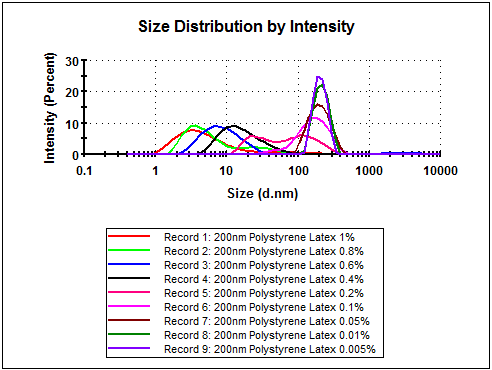 Figure 2: Effects of sample concentration on the measured size distribution for a 200nm latex standard, measured in the center of the sample cell with a Zetasizer Nano system.
The effects of multiple scattering can be minimized by shortening the path length between the scattering center and the detector. The Zetasizer Nano system, utilizing patented NIBS (Non-Invasive Back Scatter) technology, can automatically compensate for multiple scattering effects. This is achieved by movement of a focusing lens as shown in Figure 3. For small particles, or samples of low concentration, it will be beneficial to maximize the amount of scattering from the sample. As the laser passes through the wall of the cuvette and into the dispersant, the laser will “flare”. This flare may swamp the scattering signal. Moving the measurement point away from the cuvette wall towards the center of the cuvette will remove this effect (Figure 3a). Large particles or samples of high concentration scatter much more light. In this situation, measuring closer to the cuvette wall will reduce the effect of multiple scattering by minimizing the path length over which the scattered light has to pass (Figure 3b). The measurement position can be automatically determined through the intercept of the correlation function (the signal to noise ratio). This novel optical configuration accommodates dynamic light scattering measurements at concentrations never before achievable with classical 90 degree optical systems.
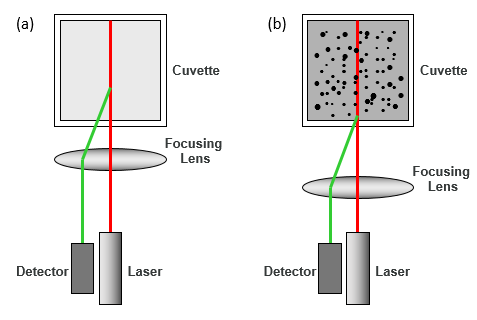
Figure 3:Schematic diagram showing the measurement position for (a) small, weakly scattering samples and for (b) concentrated, opaque samples. The measurement position is achieved by moving the focusing lens accordingly.
The true power of the Nano optical configuration over other light scattering systems can be seen in Figure 4, which shows a comparison of the concentration dependent DLS results obtained for a 200nm polystyrene latex standard measured both at the center of the sample cell and at a position determined automatically by the Zetasizer Nano. As seen here, the Z average size and correlation function intercept remain invariant across the entire concentration range examined, when automatic cell positioning is used.
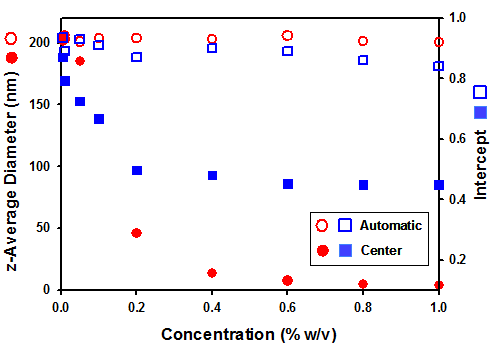
Figure 4: Comparison of the concentration dependence of the Z average size and correlation function intercept for a 200nm polystyrene latex standard, measured in the center of the cell and at a position determined automatically by the Zetasizer Nano system.
The intensity size distributions for the automatic cell positioning measurements of the 200nm polystyrene latex standard are shown in Figure 5, which clearly indicates the absence of any multiple scattering effects.
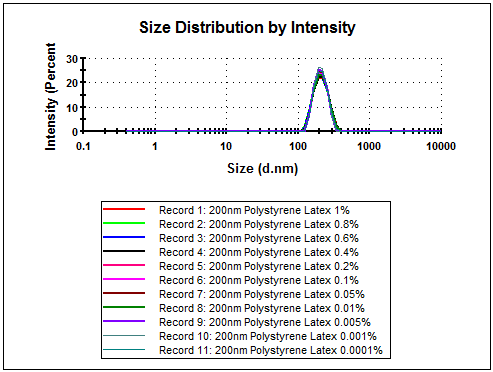
Figure 5: Effects of sample concentration on the DLS size distribution for a 200nm polystyrene latex standard measured using the automated cell positioning capability of the Zetasizer Nano.