In this data sheet, we present CT results obtained on alkaline batteries using an Empyrean diffractometer.
Zn – MnO2 alkaline batteries were investigated by computed tomography using an Empyrean multipurpose laboratory diffractometer in combination with hard X-radiation (Ag anode) and the GaliPIX3D detector. The differences between the charged and the discharged state can be clearly observed and are in agreement with results obtained at synchrotron radiation facilities.
It can provide detailed information about the object of interest, e.g. its structure, composition, defect/pore sizes and their distribution. In this data sheet, we present CT results obtained on alkaline batteries using an Empyrean diffractometer. Some of these results have been reported elsewhere [1].
Zn – MnO2 alkaline batteries were investigated by computed tomography using an Empyrean multipurpose laboratory diffractometer in combination with hard X-radiation (Ag anode) and the GaliPIX3D detector. The differences between the charged and the discharged state can be clearly observed and are in agreement with results obtained at synchrotron radiation facilities.
In order to monitor the structural changes occurring upon discharging of an alkaline battery, a commercially available cylindrical battery (AAAA type) was measured using Ag radiation (λ = 0.5609 Å) in combination with a GaliPIX3D detector in the original (1.5 V) and discharged (0.9 V) state. The alkaline batteries chosen for this purpose consist of MnO2 as the cathode material and Zn powder as the anode material [2-3].
While MnO2 is used as a solid mixture with graphite, the Zn powder is suspended in gelled KOH electrolyte.
The main chemical processes can be described in the following way:
Anode: Zn + 2OH− → ZnO+H2O + 2e−
Cathode: 2MnO2 + 2H2O + 2e− → 2MnOOH + 2OH−
During the electric discharge MnO2 is reduced by a solid-state intercalation of H+ into the MnO2 lattice. The Zn is oxidized and ZnO is formed around the core. MnO2 is transformed to MnOOH and as a consequence the thickness of the Mn layer increases.
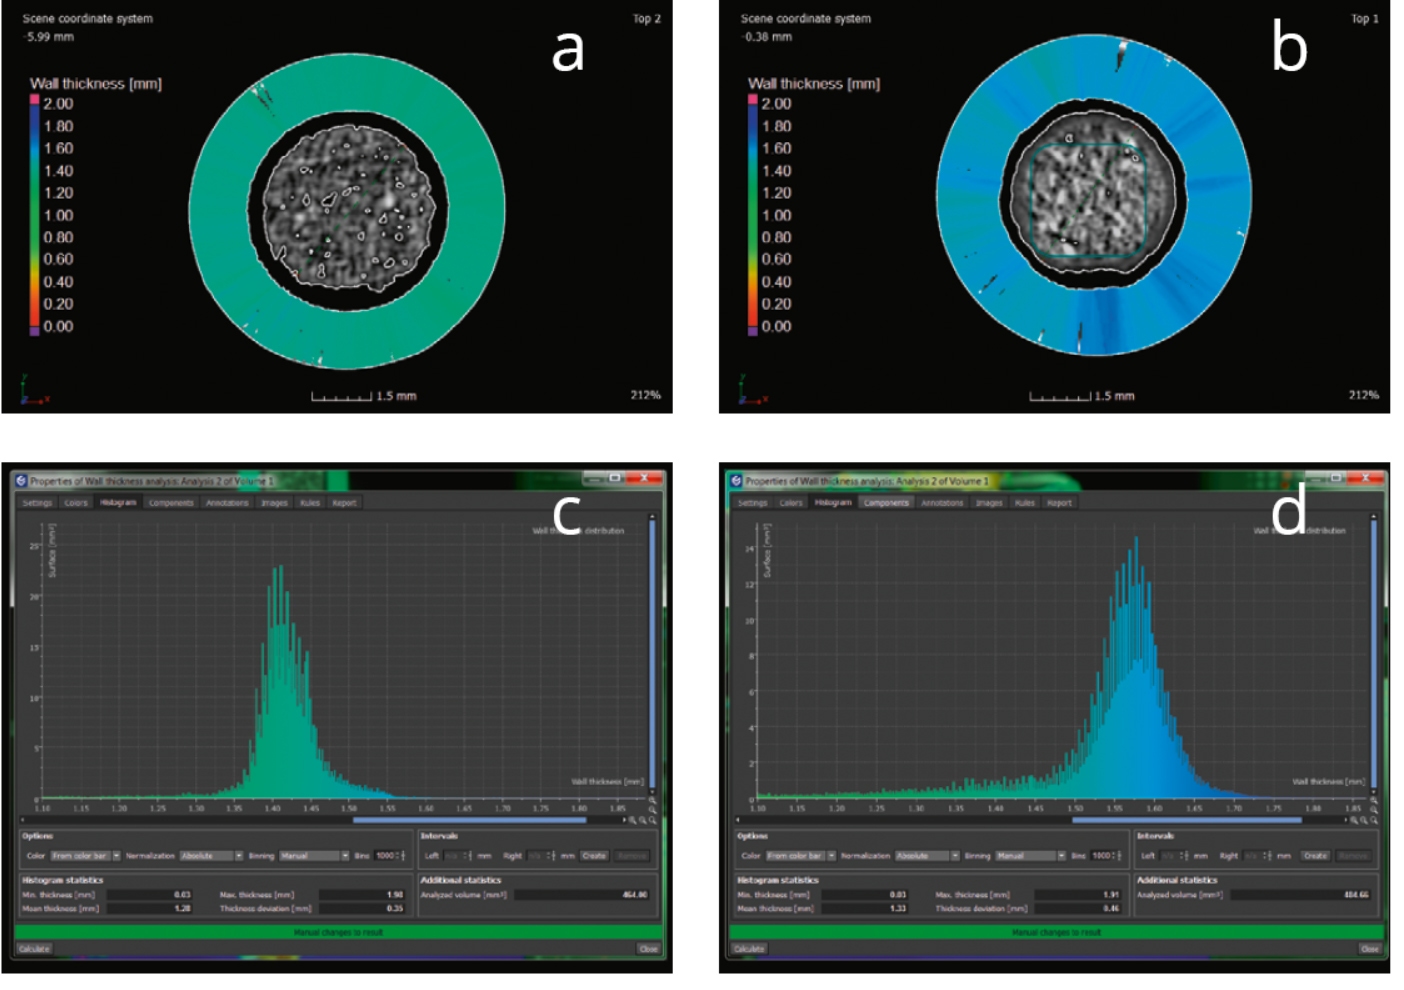
The structural changes between the charged and discharged battery can clearly be seen in the reconstructed 2D projections of the battery perpendicular to its long axis in the initial charged (Figure 1a) and discharged (Figure 1b) state. One can observe that upon discharging the Mn-containing layer has grown. This observation can be quantified with the help of the wall thickness analysis histograms (Figure 1 c-d).

Figure 1. Wall thickness analysis visualized in 2D projections (a-b) and corresponding histograms. Images a and c correspond to the initial (charged) state of the AAAA battery, images b and d to the discharged state.
The effective swelling of the Mn layer was found to be 0.2 mm (from ~1.4 mm to ~1.6 mm) which among other observations is in agreement with results obtained on similar samples at a synchrotron facility [4].
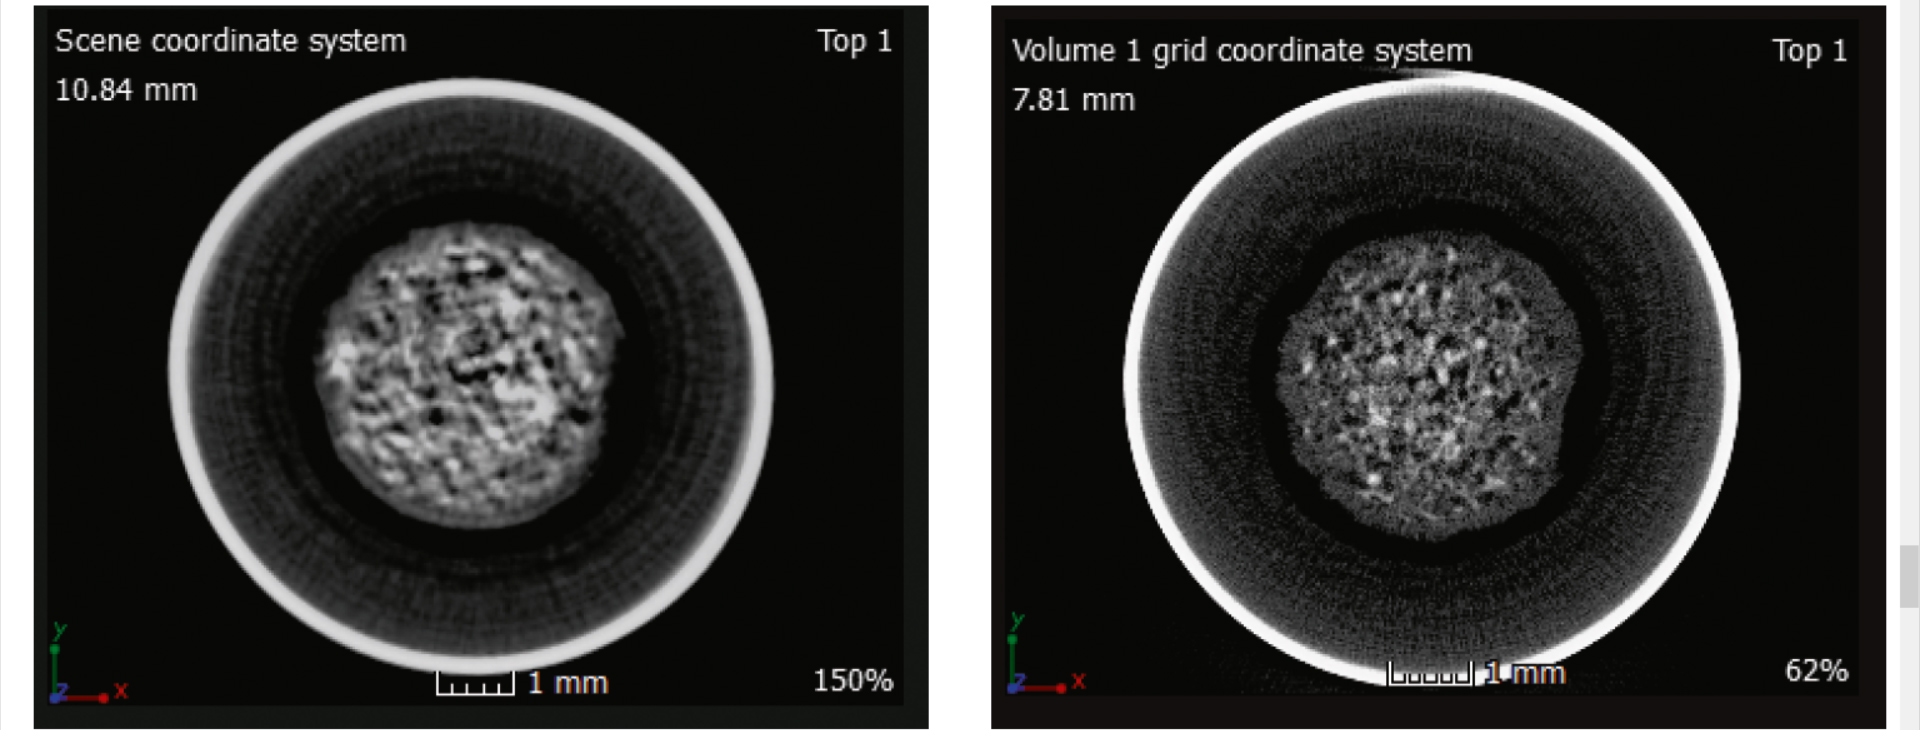
Furthermore, by using a modified setup under development for CT experiments on the Empyrean diffractometer [5], it was possible to enhance the resolution of the reconstructed images. Figure 2 shows the reconstructed 2D cross-sections of the AAAA battery in the discharged state, obtained with the standard (left) and improved setup (right).

Figure 2. 2D projections reconstructed from the data. Left, original setup; right, new setup under development. The increase in resolution is clearly visible.
Computed tomography measurements on the laboratory diffractometer Empyrean allow nondestructive analyses of the alkaline batteries upon their discharging. Applying hard radiation in combination with the GaliPIX3D detector allows visualization of the structural changes between the charged and discharged state of the battery. These results are in agreement with existing literature.
[1] N. Dadivanyan, D. J. Götz, D. Beckers and F. Masiello , Computed Tomography Experiments on a Laboratory Multipurpose Diff ractometer, Key Engineering Materials Vol. 742, pp 666, 2017.
[2] D. Linden and T. B. Reddy, Handbook of Batteries, third ed., McGraw-Hill, New York, 2002.
[3] A. J. Bard, R. Parsons, I. Jordan, Standard Potentials in Aqueous Solution, IUPAC, New York/Marcel Dekker, New York, 1985.
[4] I. Manke, J. Banhart, A. Haibel, A. Rack, S. Zabler, N. Kardjilov, A. Hilger, A. Melzer, H. Riesemeier, Appl. Phys. Let., 90, 214102, 2007.
[5] D. Beckers, European Patent submitted. (2017)