Blood serum is a source of cancer biomarkers. Tumor development is accompanied by metabolic malfunction that may result in altered serum composition: proteins that are up/downregulated and low molecular weight metabolites undergoing changes in concentration. Nowadays, researchers analyze blood serum through multifactorial techniques profiling to transform the current scenario in cancer therapy by: 1) determining patient prognosis; 2) monitoring tumor recurrence and therapeutic responses in real-time; 3) identifying new therapeutic targets; 4) elucidating drug resistance mechanisms; and 5) improving our current understanding of tumor progression and metastatic disease. One of the main advantages of using plasma samples is that only a minimally invasive assay such as a routine blood test analysis is required.
In this context Differential Scanning Calorimetry (DSC) has reveal its potential as a technique for a global analysis of serum samples. Traditionally, DSC has been employed for determining the partial heat capacity of a macromolecule as a function of temperature, from which the thermodynamic parameters associated with the structural stability of the macromolecule by thermal denaturation can be estimated1. Due to its high sensitivity, the precise determination of the thermally-induced conformational transitions of biomolecules that are present in plasma can be readily performed using DSC. The ten most abundant proteins in blood serum (albumin, IgG, fibrinogen, haptoglobin) account for 90% (w/w) of serum. Another twelve proteins represent the next 9% and 3000 proteins account for the final 1%. Interestingly, the normal serum thermogram can be reasonably reproduced with just the most abundant proteins. Therefore, serum thermograms do not provide direct information about the remaining, low-concentration serum proteins. However, the ability of those proteins, as well as disease-associated metabolites, to bind to and alter the unfolding temperatures of the most abundant proteins is responsible for the changes observed in the thermograms from disease states (that is, the interactome hypothesis).
Blood serum is a source of cancer biomarkers. Tumor development is accompanied by metabolic malfunction that may result in altered serum composition: proteins that are up/downregulated and low molecular weight metabolites undergoing changes in concentration. Nowadays, researchers analyze blood serum through multifactorial techniques profiling to transform the current scenario in cancer therapy by: 1) determining patient prognosis; 2) monitoring tumor recurrence and therapeutic responses in real-time; 3) identifying new therapeutic targets; 4) elucidating drug resistance mechanisms; and 5) improving our current understanding of tumor progression and metastatic disease. One of the main advantages of using plasma samples is that only a minimally invasive assay such as a routine blood test analysis is required.
In this context Differential Scanning Calorimetry (DSC) has reveal its potential as a technique for a global analysis of serum samples. Traditionally, DSC has been employed for determining the partial heat capacity of a macromolecule as a function of temperature, from which the thermodynamic parameters associated with the structural stability of the macromolecule by thermal denaturation can be estimated[1]. Due to its high sensitivity, the precise determination of the thermally-induced conformational transitions of biomolecules that are present in plasma can be readily performed using DSC.
Why is this important? How can DSC technology contribute to diagnosis? In 2007 Chaires and co-workers proposed DSC as a potential tool for disease diagnosis and monitoring through the analysis of blood serum from patients [2-5]. The DSC thermogram of blood plasma from healthy subjects contrasted with those from patients with different diseases (from inflammatory to oncology pathologies) [2-10]. Taneva and co-workers confirmed these preliminary studies and reported new data revealing considerable multiple myeloma-induced modifications in blood serum thermograms [11]. They also reported colorectal cancer-specific alterations in the thermal response of blood plasma proteome [12]. All these works have contributed to the validation of DSC as a potential non-invasive tool for diagnosing and discriminating several malignancies.
The underlying hypotheses in applying DSC for clinical diagnosis are: 1) blood serum is mainly composed by proteins and metabolites; 2) the metabolic alteration associated with a given pathology may alter the blood serum composition where proteins and metabolites may undergo concentration changes; 3) in addition, metabolites may not undergo conformational transitions, but they can interact with proteins modulating their thermal stability (Figure 1A); 4) the thermogram acquired through thermal denaturation is the overall result from the thermal denaturation of a collection of proteins in the presence of metabolites, and thus reflecting the protein and metabolite composition of the serum sample [2-5]. The ten most abundant proteins in blood serum (albumin, IgG, fibrinogen, haptoglobin) account for 90% (w/w) of serum. Another twelve proteins represent the next 9% and 3000 proteins account for the final 1%. Interestingly, the normal serum thermogram can be reasonably reproduced with just the most abundant proteins. Therefore, serum thermograms do not provide direct information about the remaining, low-concentration serum proteins. However, the ability of those proteins, as well as disease-associated metabolites, to bind to and alter the unfolding temperatures of the most abundant proteins is responsible for the changes observed in the thermograms from disease states (that is, the interactome hypothesis [13]). Figure 1A shows the thermal denaturation transition of a protein present in blood serum and the potential effects of either downregulation (diminished concentration) or metabolite interaction as a result of a metabolic alteration.
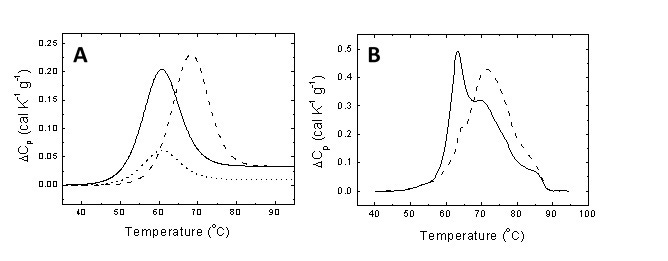
Figure 1. (A) Unfolding thermogram for a typical protein showing the endothermic peak centered at the midtransition temperature and the area equal to the unfolding enthalpy (continuous line). If the protein undergoes downregulation and its concentration diminishes as a consequence of certain pathology, the thermogram shows a reduction in area (dotted line). If a metabolite characteristic of the pathology is able to interact with the protein, it will induce a stabilization effect shifting the transition to higher temperatures (dashed line). (B) Serum thermograms for a healthy subject (continuous line) and a diseased patient (dashed line).
Figure 1B shows the serum thermograms of a healthy individual and a diseased patient. Considerable differences can be observed. Thus, pathologies and disorders in patients trigger alterations in protein and metabolite composition in serum (up- or down-regulation of specific proteins and the presence/absence of metabolites specifically related to the disease), which are mirrored by distorted thermally-induced conformational serum protein transitions and, therefore, distorted thermograms when compared to those from healthy subjects. The DSC thermogram can be considered as an instantaneous picture reflecting the health status of a given individual. In this regard, there are two key points: 1) develop appropriate analytical methodologies for comparing thermograms and extract valuable information on the differential features; and 2) correlate the differential features between thermograms with physiological differences between the individuals. The first issue can be reasonably approached employing global metric indexes (e.g., Pearson's correlation coefficient, maximal heat capacity, temperature for maximal heat capacity, thermogram moments) for measuring similarity between thermograms [14], or through multiparametric phenomenological analyses where differential features can be revealed. However, the second is a difficult task considering that some of the differences might derive from currently unknown physiological events.
It is important to emphasize some differences between the several approaches for developing diagnostic tools in cancer. In the last years genetic markers have been employed as a signature for tumor development, but these analyses only provide an estimation of the risk of developing a certain tumor (although very useful, a high probability of developing a tumor does not necessarily translate to a real event). Epigenetic markers have improved that scenario by providing additional information. However, tissue-dependent markers identified through biopsy represent the main tool for accurately establishing the existing state of health for an individual, since they provide information about the current health state for an individual. Blood serum is a quite convenient tissue for biopsy, since, contrary to other tissues, is immediately accessible through routine blood test. Thus, diagnostic and monitoring activities are not hampered by the need of sophisticated and risky procedures.
DSC blood plasma analysis can be applied to different types of cancer patients and different profile patterns have been determined through the literature. Patients in a given study should be precisely characterized and classified in order to minimize errors in defining the differential profile parameters for a certain disease. Establishing the control group constituted of healthy individuals taken as a reference for any disease is a very important point. Figure 2 shows the homogeneity of an arbitrary set of healthy subjects regarding their serum thermogram.
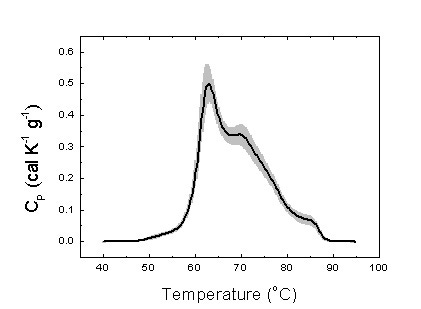
Figure 2. Average serum thermogram for 25 healthy subjects (thick line). The gray area indicates the standard deviation for the signal measured (heat capacity).
We have on different types of cancer, and we have found significant differences between pathologies (Figure 3). In particular, we have focused our attention on gastric adenocarcinoma (GAC). GAC is the fourth most common cancer and the second most frequent cause of cancer deaths worldwide [15]. We have developed a multiparametric phenomenological analytical methodology and differential features among groups of patients classified according to the severity of the disease could be identified [16]. In what follows a brief description of that study is given.
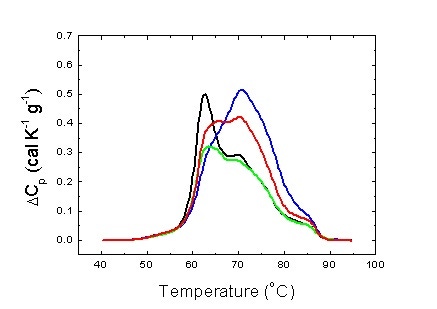
Figure 3. Average serum thermograms for different pathologies: hepatocarcinoma (blue), gastric adenocarcinoma (green) and colorectal adenocarcinoma (red). Average serum thermogram for healthy individuals is also shown (black).
Subjects. Consecutive Spanish Caucasian patients (n = 30) with GAC identified by endoscopic and pathological diagnosis at the Hospital Clinico Universitario Lozano Blesa (Zaragoza, Spain), from 2010 to 2011 were invited to take part in the study. At the time of inclusion, detailed information was recorded concerning age, gender, smoking habits, tumor-node-metastasis stage (TNM stage) according to the Union for International Cancer Control/American Joint Committee on Cancer (UICC/AJCC) classification, presence of metastases, tumor location, and histological subtype. Additional patients with hepatocarcinoma (n = 75) and colorectal adenocarcinoma (n = 50) were included in the study. The control group consisted of 25 Spanish Caucasian community volunteers apparently cancer-free, with no previous history of gastrointestinal disease, recruited from the out-patient clinical services at the same hospital. Individuals with evidence for past or present gastric ulcer, immunosuppressive disorders, and major systemic diseases were excluded. All participants gave written informed consent to the study protocol, which was previously approved and conducted in accordance with the Ethical Review Board for Clinical Research of the Regional Government (CEIC Aragon).
Sample extraction and manipulation. Approximately 10 mL of peripheral blood from each patient and control subject were collected into serum separator tubes for subsequent DSC analysis. Once processed, 200 mL serum samples were aliquoted and stored at -80°C until analysis. All experimental protocols were approved by CEIC Aragon. All experiments were carried out in accordance with the approved guidelines.
Methodology. The heat capacity of serum samples was measured as a function of temperature, CP(T), using a high-sensitivity differential scanning MicroCal VP-DSC or a MicroCal VP-Capillary Automated DSC (Malvern Instruments). Serum samples and reference solutions were properly degassed and carefully loaded into the cells to avoid bubble formation. The baseline of the instrument was routinely recorded before each assay. Experiments were performed in diluted serum samples (1:25) in PBS at a scanning rate of 1°C/min. No precipitation/aggregation occurred during thermal denaturation.
Thermograms were baseline-corrected and analyzed using software developed in our laboratory implemented in Origin 7 (OriginLab). It has been shown that the serum thermogram reflects the ten most abundant serum proteins. However, serum thermograms can be reconstructed quite well employing six individual apparent unfolding transitions only, each one modeled as a logistic peak (or Hubbert curve) and characterized by its height (proportional to the apparent concentration of protein), its center (midtransition temperature), and its width (proportional to the unfolding cooperativity level). This phenomenological multiparametric methodology was applied to GAC patients [16].
Serum thermograms from control group subjects
Figure 2 shows the serum thermograms from the control group individuals. The pattern obtained is consistent with those found in the literature [5]. That is an important finding. First, the serum thermograms are robust and reproducible. Second, these thermograms patterns are similar among individuals from different populations (American and European subjects). Both facts are essential regarding the standardization of the method.
Serum thermograms from patients
Figure 3 shows the serum thermograms obtained for patients with different tumoral gastrointestinal pathologies. The patterns obtained are considerably different to those of the control group individuals. Interestingly, there are differences between the different pathologies. This lead us to confirm that each pathology exhibit a certain pattern.
In the case of GAC, it was also possible to classify patients in terms of their disease burden (TNM stage). Figure 4 shows two examples of the deconvolution of serum thermograms using the multiparametric methodology.
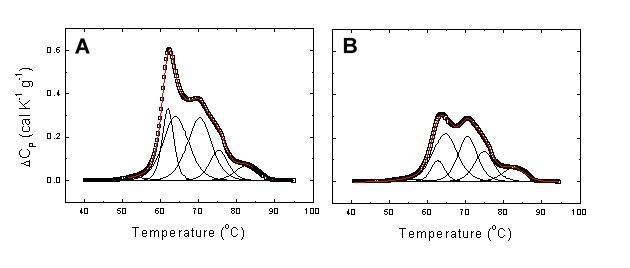
Figure 4. Experimental serum thermogram from a healthy subject (A) and a patient with stage I GAC (B). Global thermograms showing the experimental points (open squares) and the fitting curve (continuous red line). It is clear that in the GAC patient transitions 2-4 exhibit the largest changes. In particular, transition 2 undergoes a slight increase in midtransition temperature and a considerable reduction in height.
This detailed multiparametric analysis, together with global indexes (e.g., median temperature and skewness of the thermogram, temperature for maximal heat capacity, maximal heat capacity) can be employed for designing and implementing an appropriate protocol for classifying monitoring patients.
Reproducibility of serum thermograms
As in any comparative study, reproducibility of measurements is a key performance index. In our study a good reproducibility ensures the observed differential features between thermograms provide a robust subject classification procedure. Figure 5 shows repeated thermograms from serum samples. The reproducibility is excellent considering that: 1) serum thermograms were obtained by sample refilling; 2) serum thermograms were preceded by detergent cleaning; 3) serum thermograms from the same sample were not recorded consecutively.
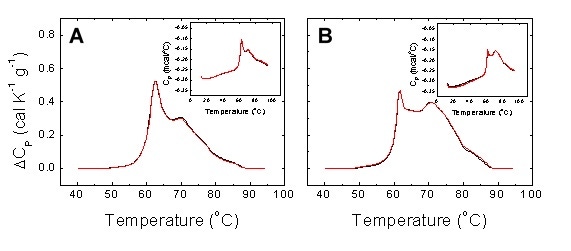
Figure 5. Reproducibility of experimental serum thermograms from a healthy subject (A) and a diseased patient (B). Two non-consecutive scans with sample refilling were performed for each individual. Detergent cleaning (Decon 90) was programmed between scans. The main plots show the normalized baseline-corrected thermograms, whereas the insets show the raw data thermograms.
DSC may become an important diagnostic tool complementary to other existing approved diagnostic techniques. Its application to cancer diagnostic is significantly progressing and the efforts from different research groups might allow the identification of the specific patterns for many tumor diseases.
DSC presents important advantages. First, it provides the serum metabolic state profile at the precise time of sample extraction, not focusing on specific biomarkers. This is important considering many diseases are currently lacking known biomarkers. Second, it provides global information on the current health state, giving a global picture of the metabolic state of serum, contrary to other diagnostic methods which provide a measure of the probability of developing a certain disease. And third, it is a quick and reasonably cheap technique that can be conveniently automated, requiring very little amounts of serum samples.
On the other hand, some issues must be addressed in the short term: 1) develop appropriate analytical methods for extracting valuable information from the serum thermograms; 2) establish correlation between differential features between serum thermograms and physiological biomarkers; and 3) explore the use of other type of samples (e.g., saliva, cerebral spinal fluid, urine…).
This application note was authored by Adrian Velazquez-Campoy (ARAID Researcher) from the Institute of Biocomputation and Physics of Complex Systems (BIFI, University of Zaragoza, Zaragoza, Spain) and Olga Abian (Miguel Servet Researcher) from Aragon Health Science Institute (IACS, Zaragoza, Spain) and IIS Aragon Foundation (IIS Aragon, Zaragoza, Spain).