This white paper discusses the principals of DSC analysis and exemplifies it with basic applications. The benefits and specifics of DSC are discussed.
The key benefit with DSC is that it is based on heat measurements and therefore allows the characterization of native biomolecules. Furthermore, the lack of spectroscopic readings means that the samples do not have to be optically clear. In addition, the characterization is not limited to the melting temperature (Tm), but it also provides data on the forces involved in folding of biomolecules and the mechanisms by which they unfold.
The thermodynamics of biological macromolecules in solution are not easy to interpret in isolation. Measured values are always the net effect of interactions between groups in the molecule and interactions that the same groups could make with the solvent. The energies stabilizing biological systems are thus the difference between many favorable as well as potentially unfavorable interactions. This fact comes as a revelation to many researchers and DSC measurements make the point very clearly. All is not lost, however, and a careful, methodical approach can begin to dissect out the complexity of the interaction. DSC also finds many other uses, based in part on the ability to see the totality of the thermodynamics associated with changes in the forces responsible for stabilizing the macromolecule and the absence of any optical components. DSC can measure how simple effects related to changes in protonation of macromolecules affect the thermodynamics and stability. This approach can be extended to include any noncovalently bound ligand, giving a versatile method of screening for binding. Under favorable circumstances, this approach can be used to determine binding constants. Here the thermodynamic background to DSC measurements is discussed and its application in studying the stability of proteins both alone and interacting with ligands. However, the techniques are equally transferable to other biological macromolecules such as nucleic acids, lipids, and so on.
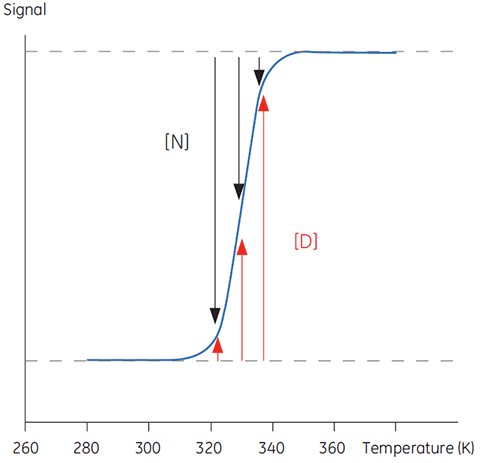
When temperature is increased outside a physiologically relevant range, proteins undergo a transition between a structured, native and biologically active conformation (N) and an unstructured, denatured and inactive conformation (D). Proteins share this behavior with many other biological macromolecules (DNA, lipids, etc.) and with organic polymers in general. If signals from the protein that reports on this conformational transition are followed, a sigmoidal trace such as below can be seen.
|
When the structure of the protein is melted in this way, there are no changes to the covalent nature of the molecule. It is only noncovalent interactions that are perturbed and, in many cases, when the protein is cooled down again these interactions will reform spontaneously, yielding the active native conformation. Thus N and D are in reversible equilibrium with temperature as an intensive variable:

|
In Figure 1 the proportions of N and D change as this equilibrium is driven toward D with increasing temperature can be seen. At any one temperature an equilibrium position can be defined, the equilibrium constant (Keq), which merely reflects the relative concentrations of N and D. In a logarithmic scale this equilibrium constant is expressed in the Gibbs free energy (ΔG):

|

|
with R, the gas constant, and T, the temperature in Kelvin. The temperature at which the concentrations of D and N are equal is defined as the midpoint of the transition or melting temperature Tm. At this temperature, Keq is equal to 1 and ΔG is 0. The Tm is an important parameter for any protein since it indicates its thermal stability. Below this temperature the concentration of native protein is higher than that of denatured, while above the Tm, more of the protein is denatured.
The reason that proteins show this melting behavior is because their native structures are stabilized by numerous interactions that have temperature dependence themselves. Stabilization by enthalpy (ΔH) requires interactions involving bond making, structuring, and reduction in internal energy, while stabilization by entropy (ΔS) reflects disordering interactions and increasing the number of ways the system can be organized with the same energy. These terms are related to ΔG in the familiar equation:

|
Combining Equations 3 and 4 and rearranging gives the van’t Hoff Equation 5 from which the variation in equilibrium constant with temperature can be plotted to yield the enthalpy and entropy of the thermal denaturation in a simple linear relationship (lnKeqvs 1/T):

|
The data in Figure 1 can be used to determine Keq at temperatures in the transition region. The enthalpy determined in this way is known as the van't Hoff enthalpy and is dependent on the shape of the DSC trace. It is thus not a direct measure of the heat of reaction.
Not surprisingly, calorimetry, from the Latin, calor, meaning heat, and metrium, to measure, is a way to determine directly the enthalpy for denaturation of a protein. Ultra-sensitive calorimeters, such as MicroCal™ VP-Capillary DSC, suitable for accurately measuring enthalpies from fractions of mg of material are available. These instruments are simple to use, accurate and reliable, making calorimetric measurements of this type a routine part of any biophysical laboratory. The systems work by measuring the heat capacity (Cp) of a sample of protein solution while scanning up or down in temperature. Cp is simply the amount of energy required to raise the sample temperature some amount, normally 1 K, and is related to enthalpy in Kirchoff’s law:

|
The excess (differential) heat capacity of the protein is measured relative to a carefully matched solvent reference cell during the scanning and hence these types of instruments are known as differential scanning calorimeters.
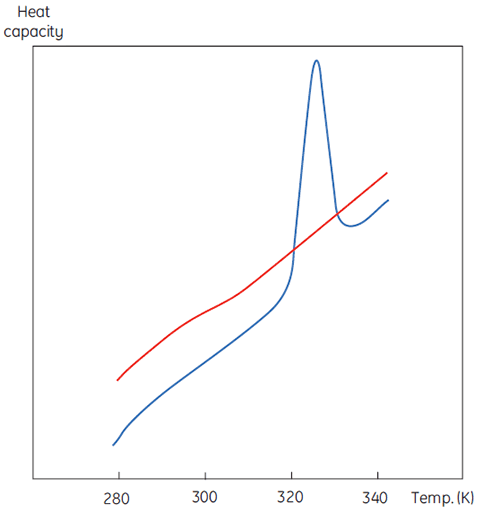
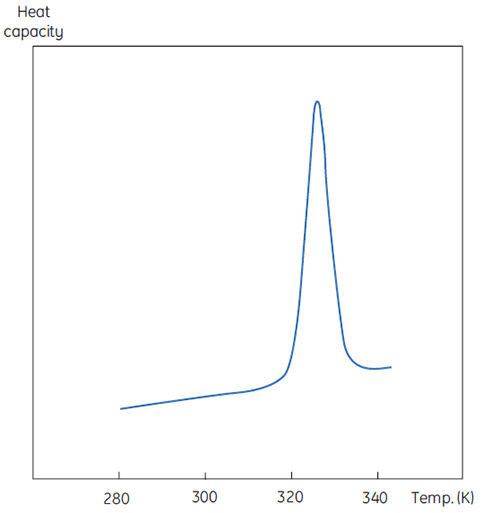
A DSC measurement is identical to Figure 1 except that now the property of the protein followed during the denaturation is heat capacity. A conformational transition such as in Figure 2 will be observed.
|
|
From Equation 6 it is clear that to obtain the enthalpy the excess heat capacity function must be integrated. Before this can be done, the instrumental baseline which is observed when both the sample and the reference cells contain solvent only must be removed. For technical reasons, the instrumental baseline does not give a zero excess heat capacity between the cells (red solid line, Fig 2 upper panel). After baseline subtraction, the linear regions on either side of the transition peak, which represent the heat capacity of the native and denatured states of the protein, is extrapolated into the transition and then merge them in relation to the progression through the transition. This is done with software routines. Finally, the area under the resulting peak is integrated to give the excess energy that the DSC requires to denature the protein in the sample cell. Provided that the concentration of the protein solution and the operational volume of the calorimeter cell are known, this energy can be converted into ΔH in calories or Joules per mol of protein. Normally ΔHcal is used to indicate a directly measured calorimetric enthalpy.
MicroCal VP-Capillary DSC is a very sensitive instrument capable of measuring very small changes in heat capacity associated with protein denaturation in a dilute solution. The heat capacity of the solvent exceeds that of the protein by many orders of magnitude. Thus for the most accurate and reliable measurement the background heat capacity must be eliminated carefully by ensuring that the solvent for the protein sample and reference solutions are exactly matched in composition. Dialysis or chromatography are suitable methods, with the final dialysate or column flowthrough used as the reference solution.
The data in Figure 2 can also be analyzed in the same way as any other property of the protein that undergoes a change on denaturation as discussed above. This gives the Tm and the model-dependent van’t Hoff enthalpy; now ΔHvH to distinguish it from ΔHcal. Comparison of these two measurements of enthalpy, which are obtained in the same experiment, provides a powerful test for the model of protein denaturation. ΔHvH gives the energy per mol of the cooperative unit in the equilibrium while ΔHcal gives the energy per mol of protein. If these energies are the same then the protein and the cooperative unit are the same, or can be envisaged as having identical molecular weight, thus confirming the two state assumption of the equilibrium.
In alternative scenarios, ΔHvH is smaller than ΔHcal, suggesting that the average molecular weight of the equilibrium species is lower than that of the protein and that a denaturation scheme involving intermediates (I) may be more appropriate:

|
In extreme cases of intermediates occurring during denaturation, such as when proteins have independently folding domains of differing thermal stability, two distinct transitions may be observed. Here, ΔHvH of each transition will reflect the molecular weight of each domain while ΔHcal, based on the molecular weight of the entire protein, will reflect the total energy to denature the system, that is the total area under the two transitions.
There can also be cases where ΔHvH is larger than ΔHcal suggesting that the size or molecular weight of the species in the equilibrium is larger than that of the protein. This would be the case where the protein forms dimers, tetramers, or higher order aggregates with the ratio of ΔHvH to ΔHcal reflecting, at least in principle, the order (n) of association:

|
Unlike Equation 7, this is still a two-state equilibrium since only N and D are included. The discrepancy in the ratio of ΔHvH to ΔHcal reflects the fact that the concentration per mol term in the calculation was based on the subunit rather that the oligomeric protein.
This also raises the important point that the value of ΔHcal is totally dependent on the sample concentration. Any errors in the concentration will be transferred directly into the estimate of enthalpy. These include errors in the physical measurement of concentration, usually by absorbance spectroscopy, errors in the extinction coefficient of the protein, as well as errors introduced by less than 100% pure material (contaminant proteins contribute to absorbance but have different Tm values which may not be seen in DSC) or less than 100% folded native material (denatured protein contributes to absorbance but is already unfolded). Thus some care must be taken in interpreting smaller discrepancies in the ratio of ΔHvH to ΔHcal.
The accurate quantitation of sample purity and concentration is the most important element of experimental design and data interpretation in DSC.
If the ratio of ΔHvH to ΔHcal suggests an oligomeric denaturation scheme (Eq 8) it is easy to confirm this by checking the concentration dependence of the DSC measurement. Since the equilibrium involves a change in concentration of say, the monomeric form, then the concentration of monomer will, by mass action or Le Chatelier’s principle, affect the equilibrium position. Thus the thermal stability of an oligomeric system is expected to increase with increasing concentration as is seen in practice (1,2).
Checking for sample concentration dependence in DSC measurement is a key test of the mechanism and is always worth doing, if sample availability permits, even when the calculated ratio of ΔHvH to ΔHcal is close to 1.
Having completed a DSC measurement, a simple and potentially informative experiments is to rescan the same sample again. If an identical endotherm is observed during the rescan, it can be concluded that the interaction is fully repeatable with the native and denatured states in equilibrium. In a significant number of cases there is, however, no transition or one of reduced magnitude on rescanning the protein. This indicates that there is an irreversible step in the denaturation mechanism:

|
In this unimolecular (U) scheme processes such as deamidation, proline isomerization and so on can lead to irreversible modification and prevent refolding. Often, repeatability can be improved by scanning to temperatures just above the transition region, rather than to the highest temperature the DSC will reach, because there is a kinetic element (rate) to the irreversible step. This rate will most likely be faster at higher temperatures. Thus the higher the temperature accessed and the longer the time spent denatured, the more the irreversible step proceeds.
The irreversible step may also result from association or aggregation (Ag) of the denatured state:

|
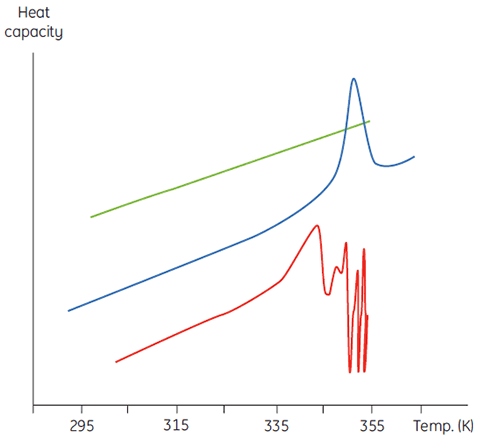
This will manifest itself in a concentration dependence of the initial scan parameters. At higher sample concentrations the concentration of D will be increased so that the irreversible step is accelerated, leading to a lower Tm for the protein. In cases of significant and rapid aggregation it may even be possible to distort and truncate the denaturation transition with the exothermic aggregation event and observe atypically noisy data above the transition region, such as below.
|
Calorimetry is not a forgiving technique in this respect and it is often DSC that flags up aggregation problems that are not obvious in spectroscopic-based thermal denaturation experiments done at similar sample concentrations. In both cases of irreversibility, it is informative to examine the sample concentration and scan rate dependence of the DSC measurements. Indeed, in some cases such information can be used to extract meaningful parameters from the initial equilibrium event and even estimate values of the irreversible rate (3,4).
Checking for scan-rate dependence in DSC measurements is a key test of the mechanism and is always worth doing if sample availability permits, even when the system is highly repeatable and at equilibrium. Even in the simplest unimolecular equilibrium (Eq 1) it must be confirmed that the equilibrium concentrations of N and D reflect the stability of the system under those conditions. These concentrations change at a rate equal to the sum of the forward (unfolding) and reverse (folding) reactions in the equilibrium. Thus if the temperature is increased faster than the system can change, the position and shape of the DSC endotherm will be distorted. This will lead to incorrect Tm values and anomalous ΔHvH to ΔHcal ratios. As a rule of thumb, 60 K/h is a good starting point for most proteins.
As well as this comparative use of the enthalpies, the techique provides an accurate determination of the enthalpy itself and a Tm value. As already noted, the Tm is a reflection of the thermal stability of the protein. This should not be directly equated with stability in the sense of longevity of activity in the sample or its shelflife since this can have an additional kinetic dimension introduced by an irreversible step. In the simplest equilibrium (Eq 1) with perfect reversibility, the protein has, in theory, an infinite shelflife. Obviously, at a temperature above the Tm the active native state is less populated and the level of activity is correspondingly reduced. Below the Tm the system will potentially regain the active native structure. In the simplest case of irreversible denaturation (Eq 9), at temperatures above the Tm, the rate of nonequilibrium step, which is in competition with the rate of folding from D to N, will determine how long the protein will retain the opportunity of populating the active native state. Even well below the Tm, where the equilibrium constant means that most of the protein is in the native state, the fact that D to U is irreversible means that once converted to U the molecules are no longer in the equilibrium. To maintain the appropriate [D]/[N] ratio, as dictated by Keq, native protein will become denatured. Once again, it is the kinetic rate that determines how long native and active protein will remain. This said, it is clearly judicious to store a protein well below its Tm and common sense dictates that Tm and shelflife will be correlated. All rates of reaction will be slowed at lower temperature including the D to U step. In addition, if, as is often the case, the irreversible step involves aggregation of two or more denatured proteins (Eq 10), then the lower the concentration of D, the slower will be the rate for this reaction.
It is also misleading to equate thermal stability with the equilibrium stability of a protein at temperatures far from its Tm. Extrapolation of the equilibrium constant, and thus ΔG, away from the Tm is complex and depends on a number of parameters that are considered below. This extrapolation is markedly nonlinear so that protein with a high Tm will not necessarily have a larger ΔG at lower temperatures than other proteins with lower Tm values.
The enthalpies that are determined in a DSC experiment apply to the Tm of measurement, since this is the midpoint of their determination. At this temperature ΔG is 0, and from Equation 4, ΔS = ΔH / Tm. In other words ΔS is obtained by elimination, but not by measurement, and all errors in determination of ΔH and Tm will propagate into ΔS.
It would be nice to think that these fundamental thermodynamic quantities would give a profound insight into the forces stabilizing protein structures. After all, proteins are very much like biological Lego™. For the toy, there are only a few types of bricks and they only join in a few ways, yet the diversity of structure and function that can be built up within these limitations is enormous. In biology there are only a limited number of chemical groups (bricks) in a protein polypeptide that can interact; groups from the backbone carboxyl and amide and from the amino acid side chains. These groups use an equally small set of interactions to join themselves together: Van der Waals forces, hydrogen bonding, electrostatic charge-charge attractions and hydrophobic effects. Such interactions, by their noncovalent nature, are systems at equilibrium between two extremes, interacting and noninteracting and so can be described by the thermodynamics described above. Thus the ΔH and ΔS determined for the denaturation of a protein must tell something about the nature and strength of these interactions.
Regrettably, these are information-rich quantities. In an average protein there will be many hundreds of interactions and these will sum over the whole molecule to determine its thermodynamics. It is not possible to disturb one interaction in isolation. Typically, the protein shows a high level of cooperativity in its structure so that either all the interactions are made and the protein is native, or all the interactions are broken and the protein is denatured.
Furthermore, each of the chemical groups in the protein can also interact intermolecularly with water and dissolved salts, as well as intramolecularly with each other. The thermodynamics of each interaction will thus reflect the net difference between the groups coming together and when they are separately solvated by water molecules, making the situation even more complex.
Despite the inability to interpret values of ΔH and ΔS in isolation, there is still a great deal that can be done with these parameters. They are determined at Tm where ΔG is 0 so if we were to know their temperature dependence then ΔG could be calculated at all other temperatures. To do this, the change in heat capacity (ΔCp) for denaturation of the protein must be known. Since DSC measures heat capacity, the change on denaturation may be potentially determined directly from these data (Fig 2). Indeed, the progress baseline function had to be applied prior to integration of the peak area because of this very difference.
ΔCp for proteins is, as seen in Figure 2, large and positive. Its value is available from each DSC experiment but it can also be determined just as accurately simply from the size of the protein (5). The larger the protein the larger is ΔCp, reflecting the fact that its value correlates very well with the total nonpolar surface buried by the protein when it folds to the native state.
The variation of ΔH and ΔS with temperature are another way of expressing the Kirchoff relation:

|
leading to a temperature dependance of ΔG calculated according to:

|
Equation 11 also provides another method of determining ΔCp. If ΔH for a protein is measured under differing conditions of stability, then the variation of ΔH, δΔH/δT, will give ΔCp. Provided that these experiments use appropriate buffers as discussed below, this is probably the most accurate estimate of ΔCp since it is based on a number of independent measurements of ΔH.
With Equation 12, ΔG, ΔH and ΔS can be calculated at any other temperature of interest. Such estimates will have an error reflecting the original error in the measured Tm and ΔH as well as the length of temperature extrapolation away from the Tm. With longer extrapolations in temperature the compounded errors can become significant and some estimation of their size should be made when they are quoted. To compare ΔG,ΔH and ΔS between systems or under different solvent conditions, it is essential to extrapolate the measured data to a common temperature of comparison.
It is quite meaningless to compare the experimentally determined ΔH of denaturation for two proteins since these are measured at their respective Tm values. Such a comparison requires extrapolation of the ΔH data to a common temperature using the ΔCp of each protein. This temperature is preferably the mid point between the two Tm values (T1m+ T2m)/2 to minimize the extrapolation errors.
On a qualitative level comparisons of this type can be made and may flag up some gross change in the system. As already noted, the complexity of the denaturation process makes any detailed interpretation of data, or changes in its values, extremely difficult. Nevertheless, there are certain experimental strategies that may eventually begin to shed some light on the contributions of specific interactions to stabilizing protein structures. Site-directed mutagenesis changes specific side chains in a protein and can be used in a very subtle way, for instance by deleting a single methyl moiety buried in the core of the protein.
If the thermodynamics of these mutations can be augmented with high-resolution structural information on the parent protein and the mutant, there is some chance to interprete the changes. Such an approach can be extended to double or triple mutant cycles to confirm the validity of interaction energies or to include changes in solvent (H20 vs D20) to probe hydrogen bonding (6).
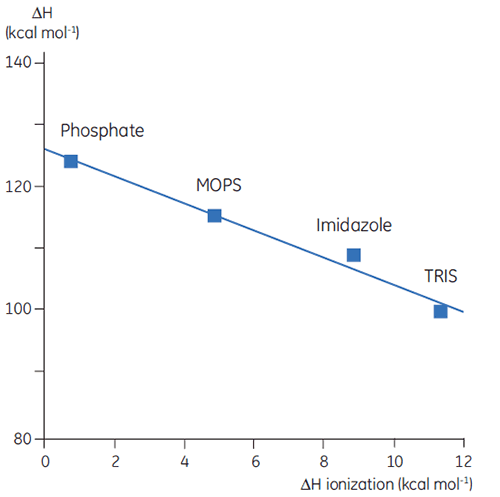
Thus far we have seen that the complexity and information content of thermodynamic data is problematic. However, there are ways to take advantage of this that gives DSC valuable uses. For example, the amino acid side chains in proteins that have protonatable groups may undergo a shift in pKa during denaturation. In the native state they are interacting with other charged groups while in the denatured molecule they are interacting with the solvent. The pKa is simply a representation of the equilibrium constant for the group between its protonated and unprotonated forms and if this equilibrium changes during denaturation, then protons will be released or taken up by the protein. Since a buffer is present in the studies and acts to maintain pH (proton concentration), the protons involved in the protein denaturation equilibrium will be taken up or provided by the buffer, a process that will also have an associated enthalpy. This enthalpy is different for each buffer depending on its chemistry. So if ΔH is measured for protein denaturation in different buffers at the same pH, different values will be observed, reflecting the sum of ΔH for the protein event and ΔH for the buffer ionization. Plotting the observed values against the ΔH of ionization for the buffers will give a linear function whose slope (positive or negative) reflects the number of protons (sum of all pKa shifts) associated with the denaturation of the protein.
|
The choice of buffer is important when designing DSC experiments. For routine work, a buffer with a small or zero enthalpy of ionization is preferable since this eliminates any ionization contributions in the measurement. Buffers such as formate, acetate, and phosphate are good choices since they have negligible heats of ionization, are available in high purity, and are cheap. These buffers also have the added advantage that their pH remains constant with changes in temperature; obviously an important factor for DSC measurement. This is again a consequence of their small heats of ionization.
Another consequence of a protein having protonatable groups whose pKa is different in the native and denatured state is that its Keq, and thus ΔG, will be dependent on solution proton concentration, that is pH. This follows from the law of mass action or Le Chatelier’s principle. If the denaturation Keq affects the pH of the solution by releasing or taking up protons then it holds that the solution pH will affect Keq of the protein. This effect can be quantified in:

|
where Δυ is the change in protonation. The larger the change in protonation upon dentauration, the larger the change in stability for each pH unit. The effect is only manifested where there is a potential difference in protonation states between the pKa of the group in solution, exposed as it is in the denatured state, and the pKa of the group in the native state where it may interact with oppositely charged groups, lowering its pKa or with like-charged groups which act to raise its pKa. Typical pKa shifts in proteins are up to two units. Proteins normally have a bell-shaped stability pH profile and this reflects exactly this effect. The pKa of acidic groups in proteins is around 4 and that of basic groups around 10 so the major changes in stability occur between 2 and 6 and between 8 and 12. At neutral pH, the only pKa is that of histidine and this may or may not modulate stability in this region.
DSC can be used to determine the thermal stability of a protein at virtually any pH of interest. The Tm and ΔH can be used to calculate ΔG at a common temperature of comparison and the pH stability profile can be analyzed using Equation 13 to obtain the protonation change of denaturation at any pH. The effects of specific mutation of charged residues in the protein on these profiles can indicate which groups are involved in the protonation behavior.
It could be convenient to think of proteins as simple non-covalently attached ligands that have different ‘affinities’ (pKa) for the native and denatured states. With this analogy in mind, we can immediately see that the effects of mass action must apply to any ligand that has different binding affinity to the native and denatured states. Most, if not all biologically relevant ligands bind tightly and specifically to the native states of their cognate proteins and have no affinity for the corresponding denatured states. Therefore, when they denature they release ligand into solution affecting the concentration. The mass action effect is that when the concentration of ligand in solution is changed it will affect the native to denatured equilibrium, that is the stability of the protein.
This approach can be used in two ways, firstly as a crude screening tool for ligands that bind to a protein. The thermal stability of a protein is measured on its own and then in the presence of the ligands to be screened. These are added at some level of excess concentration over the protein to ensure that ligands binding with reasonable affinities will saturate the binding sites on the protein. In cases where the thermal stability is increased there is evidence that at the temperature of denaturation there was stabilization of the protein through binding to the native state. The opposite holds in that a decrease in thermal stability suggests a ligand binding to the denatured but not the native state. Some caution must be attached if the changes in thermal stability are small since the ligands may also act indirectly to change ionic strength or pH, which could then modulate stability. Suitable controls can resolve these possibilities.
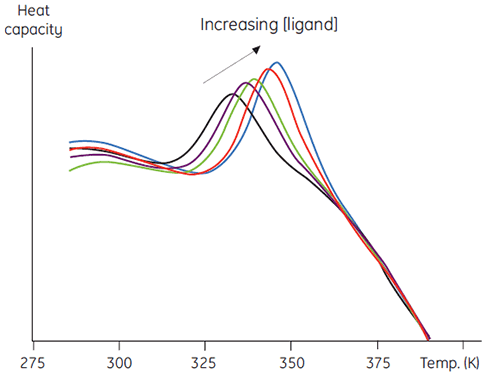
A second, more quantitative use of this method involves measuring thermal stability as a function of increasing ligand concentration. Data such as in Figure 5 result and this can be used to obtain an estimate of the binding constant between the ligand and protein (7).
|
There are several advantages to this approach over other more conventional methods. The method may be used to determine very tight binding constants that cannot be measured in conventional equilibrium methods. The signal measured is ΔH, which is a universal feature of protein denaturation, so there is no need to develop specific methods for each protein studied. In addition, high concentrations of ligands that can be problematic in spectroscopic methods can be used. Mixtures of ligands can be used to screen for competitive binding to a known ligand, or in elaborate combinatorial screening protocols.
Recent advances in DSC instrumentation and automation technology have allowed the production of an automated high-throughput DSC, MicroCal VP-Capillary DSC (8). As well as using automatic robotic sample loading, these instruments scan at faster rates making the whole measurement more rapid. Prior to using higher scan rates it is wise to check the dependence of the Tm and enthalpies on this parameter to make sure the system is at equilibrium as discussed above. Once this is established the system can acquire up to 25 scans or so in a 24 h period and can be loaded with samples, held in a refrigerated compartment, that will allow the instrument to run for a week.
This automated approach to DSC is a powerful analytical tool for characterizing the stability of proteins and other biomolecules. Solution conditions (pH, ionic strength, additives) that affect the thermal stability of a protein can be rapidly assessed. This information might be of use indicating optimal conditions for shelflife studies or crystalization trials. Similarly, ligands that bind to a protein, and thereby increase its thermal stability, could be characterized for, or evaluated in detail following their identification in a higher throughput primary screen.
| Resource | Link |
|---|---|
| Recorded webinar: mRNA-LNP biophysical characterization with microcalorimetry | View resource |
| Recorded webinar: Application of DSC to structural studies on meningitis vaccines | View resource |
| Technology: Differential Scanning Calorimetry (DSC) | View resource |
This White paper is authored by Dr Chris M. Johnsson, currently employed at the MRC Centre for Protein Engineering, Hills Road, Cambridge, CB2 2QH, UK. email; cmj@mrc-lmb.cam.ac.uk
Neet, K.E. and Timm, D.E. Conformational stability of dimeric proteins: Quantitative studies by equilibrium denaturation. Prot. Sci. 3, 2167-2174 (1994).
Johnson, C.R. et al. Thermodynamic analysis of the structural stability of the tetrameric oligomerization domain of p53 tumour suppressor. Biochemistry 34, 5309-5316 (1995).
Freire, E. et al. Calorimetrically determined dynamics of complex unfolding transitions in proteins. Ann. Rev. Biophys. Chem. 19, 159-188 (1990).
Lepock, J.R., et al. Influence of transition rates and scan rate on kinetic simulations of differential scanning calorimetry profiles of reversible and irreversible protein denaturation. Biochemistry 31, 12706-12712 (1992).
Myers, J.K. et al. Denaturant m values and heat capacity changes: relation to changes in accessible surface areas of protein unfolding. Prot. Sci. 10, 2138-2148 (1995)
Connelly, P.R. et al. Enthalpy of hydrogen bond formation in a protein ligand binding reaction. Proc. Natl. Acad. Sci. USA, 91, 1964-1968 (1994).
Brandts, J.F. and Lin, L.N. Study of strong to ultratight protein interactions using differential scanning calorimetry. Biochemistry 29, 6927-6940 (1990).
Plotnikov, V.V. et al. An autosampling differential scanning calorimeter instrument for studying molecular interactions. Assay Drug Dev. Technol. 1, 83-90 (2002).
Cooper, A. et al. Differential scanning microcalorimetr, in Protein-Ligand Interactions: hydrodynamics and calorimetry (Harding, S. E. and Chowdhry, B. Z. eds.), Oxford University Press, pp 287-318 (2000).
Freire, E. Differential Scanning Calorimetry. Methods Mol. Biol. 40, 191-218 (1995).
Privalov, P.L. and Potekhin, S.A. Scanning microcalorimetry in studying temperature-induced changes in proteins. Methods Enzymol. 131, 4-51 (1986).
Plum, G.E. and Breslauer, K.J. Calorimetry of proteins and nucleic acids. Curr. Opin. Struct. Biol. 5, 682-690 (1995).
Clas, S.D. et al. Differential scanning calorimetry : applications in drug development. Pharm. Sci. Technol. Today 8, 311-320 (1999).
Clausse, D. et al. Morphology characterization of emulsions by differential scanning calorimetry. Adv. Colloid Interface Sci. 117, 59-74 (2005).
Beezer, A.E. et al. Pharmaceutical microcalorimetry: applications to long-term stability studies. Int. J. Pharm. 179, 159-165 (1999).
Jelesarov, I. and Bosshard, H.R. Isothermal titration calorimetry and differential scanning calorimetry as complementary tools to investigate the energetics of biomolecular recognition. J. Mol. Recognit. 12, 3-18 (1999).
Plotnikov, V.V. et al. A new ultrasensitive scanning calorimeter. Anal. Biochem. 250, 237-244 (1997).