This study is to determine if NIR is a useful tool to determine various properties of bread and cake flour. Specifically, the intent is to determine Protein (ds), Softness (avg.), Volume (avg.) and Moisture (%) properties.
A LabSpec 4 with a wavelength range of 350 to 2500 nm and a contact probe were used for this study. The LabSpec 4 system features three modular spectrometers, each collecting a portion of the entire wavelength range. The contact probe is designed for contact measurements of solid raw materials such as minerals, grains, and other granular materials.
By Don Campbell, Applications Chemist, SummitCAL Solutions Team
This study is to determine if NIR is a useful tool to determine various properties of bread and cake flour. Specifically, the intent is to determine Protein (ds), Softness (avg.), Volume (avg.) and Moisture (%) properties.
A LabSpec 4 (LS4) with a wavelength range of 350 to 2500 nm and a contact probe were used for this study. The LS4 system features three modular spectrometers each collecting a portion of the entire wavelength range. The contact probe is designed for contact measurements of solid raw materials such as minerals, grains and other granular materials. It also allows for the measurement of samples through clear and transparent plastic bags. Illumination is provided by a halogen lamp within the probe assembly. This device also measures diffuse reflectance spectra.

Figure 1: LS4 shown with the ASD contact probe sample accessory
ASD spectrometers collect spectra at the rate of 0.1 seconds per scan and a sample count of 100 using three subsamples was used for this calibration development project. This required a scan collection time of 10 seconds times 2 replicates for each sample for a total scan collection of less than 30 seconds.
Files were imported into GRAMS format as absorbance spectra. All spectra were then modeled using GRAMS/AI, version 8.0, with PLSplus/IQ chemometrics package from Thermo Fisher Scientific, Inc. A typical bread flour spectrum is shown in figure 2.
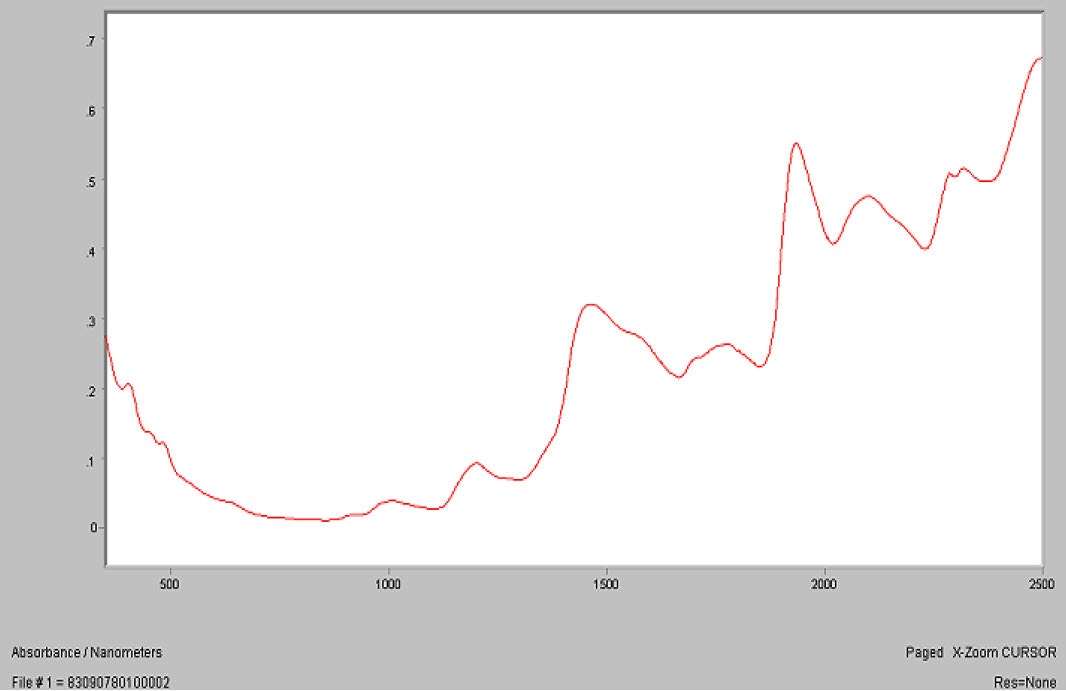
Figure 2: Typical bread flour spectrum
PLS1 models were developed for Protein (ds), Softness (avg.), Volume (avg.) and Moisture (%) using the full range (350-2500 nm) instrument configuration with the LS4. Cross validation techniques used “Files Out” equal to the number of sample replicates, which in this case were two spectra. An independent sample test set spanning the entire range of Protein (ds), Softness (avg.), Volume (avg.) and Moisture (%) measurements was selected in order to validate the models.
The first set of plots shows the regression created for measuring the Protein (ds) property of both bread and cake flour. Correlation (RSQ) for the calibration set was 0.98 and the RSQ for the test set was 0.96. The average M-distance for the calibration set was 0.93 and the average for the test set was 1.15. M-distance gives us an idea of how well the test spectra fit within the range of spectra used to generate the model. Typically, M-distances less than or equal to three indicate a good fit. The calibration used 7 factors for the PLS1 model. SECV for the calibration data was 0.27 and SEP for the test data was 0.38. One hundred thirty pairs of samples were provided for use as a calibration set with this study.
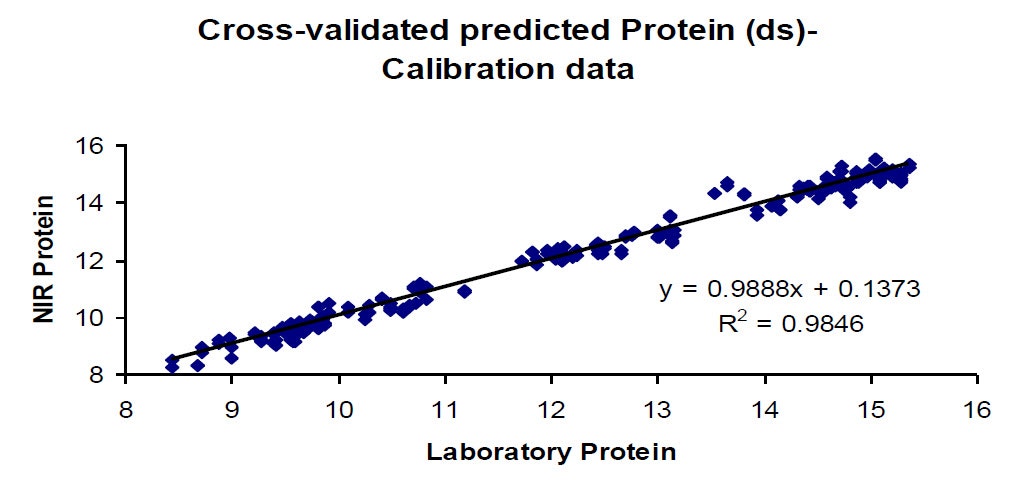
Figure 3: Regression plot for Protein (ds) on Calibration set
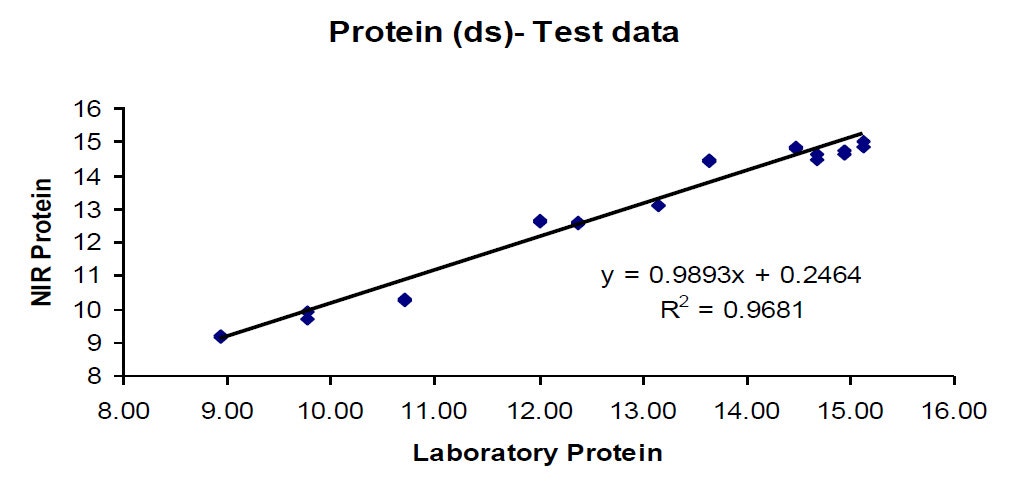
Figure 4: Test set predicted on Protein (ds) model
The next set of plots shows the regression created for measuring the Softness (avg.) property of the bread flour. RSQ for the calibration set was 0.71 while the RSQ for the test set was 0.94. The average M-distance for the calibration set was 0.93 and the average for the test set was 1.30. The calibration used 3 factors for the PLS1 model, which was an appropriate number of factors for the number of samples in the calibration set. SECV for the calibration data was 18.64 and SEP for the test data was 8.93. Sixty eight pairs of samples were provided for use as a calibration set with this study.
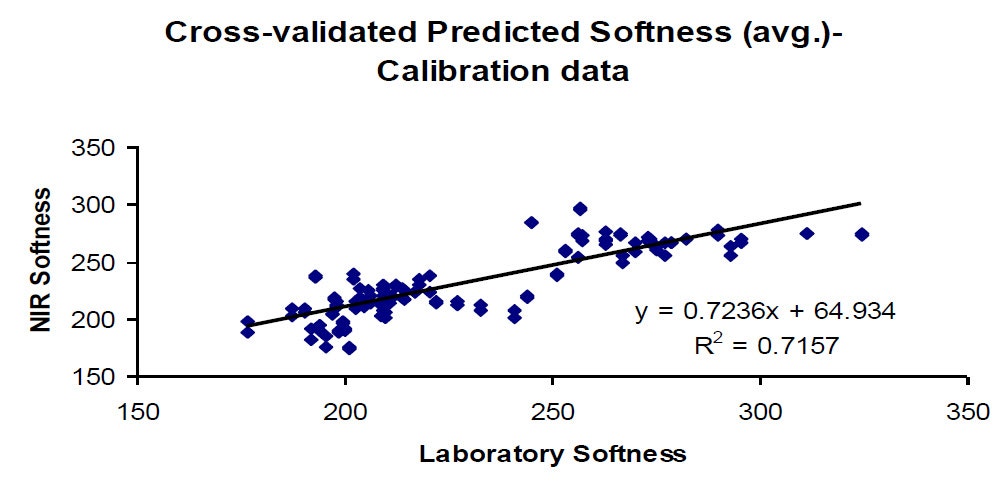
Figure 5: Regression plot for calibration set on Softness (avg.) property
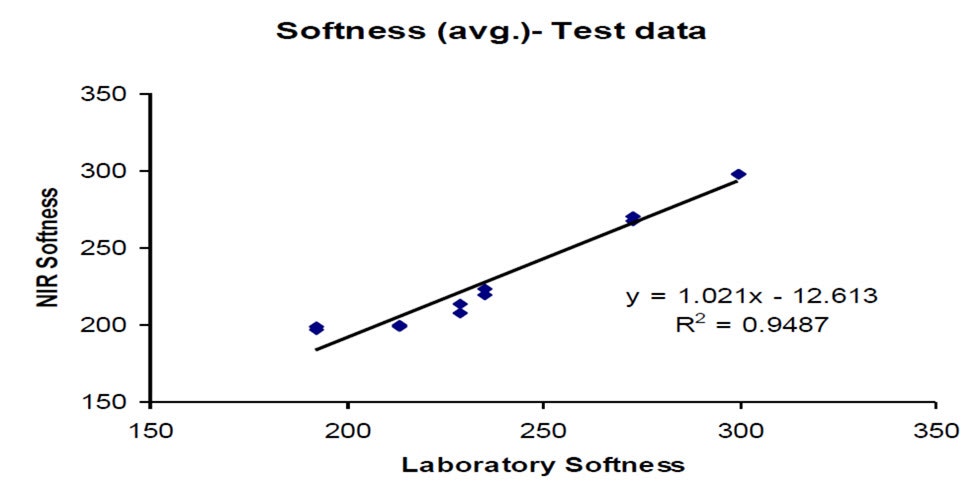
Figure 6: Prediction of test set on Softness (avg.) model
The next set of plots shows the regression created for measuring the Volume (avg.) property of the bread flour. RSQ for the calibration set was 0.71 while the RSQ for the test set was 0.94. The average M-distance for the calibration set was 0.93 and the average for the test set was 1.17.
The calibration used 3 factors for the PLS1 model, which was an appropriate number of factors for the number of samples in the calibration set. SECV for the calibration data was 156.1 and SEP for the test data was 81.9. Sixty eight pairs of samples were provided for use as a calibration set with this study.
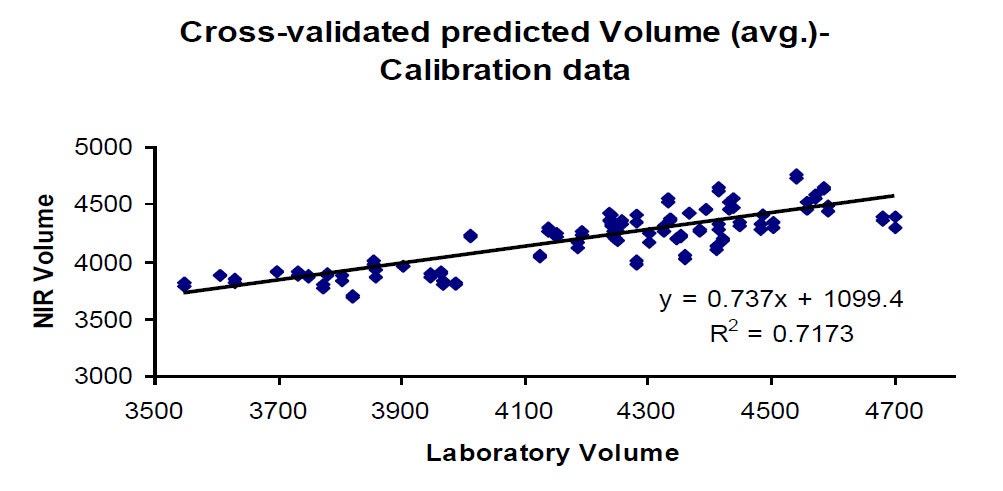
Figure 7: Regression plot for calibration set on Volume (avg.) property
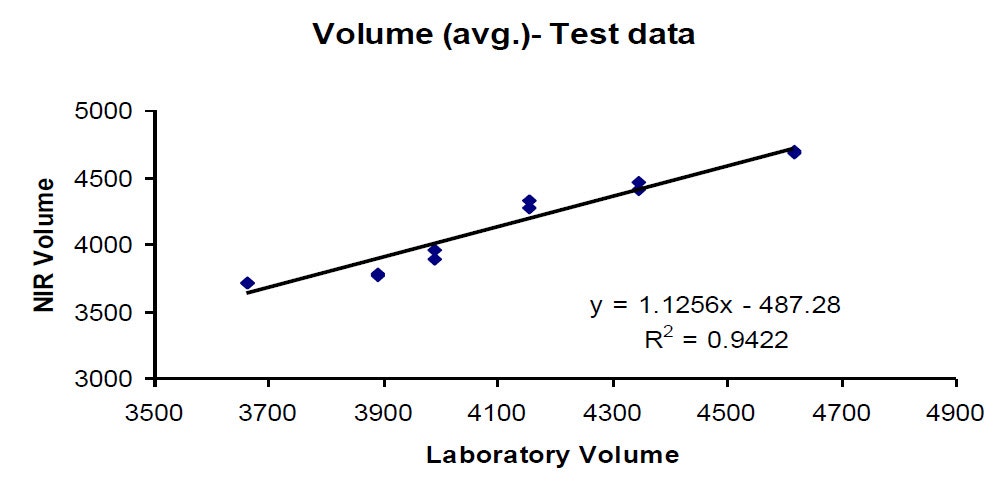
Figure 8: Prediction of test set on Volume (avg.) model
The final set of plots shows the regression created for measuring the Moisture (%) property of both bread and cake flour. RSQ for the calibration set was 0.99 while the RSQ for the test set was also 0.99. The average M-distance for the calibration set was 0.94 and the average for the test set was 1.08. The calibration used 3 factors for the PLS1 model, which was an appropriate number of factors for the number of samples in the calibration set. SECV for the calibration data was 0.16 and SEP for the test data was 0.15. Sixty-eight pairs of samples were provided for use as a calibration set with this study.
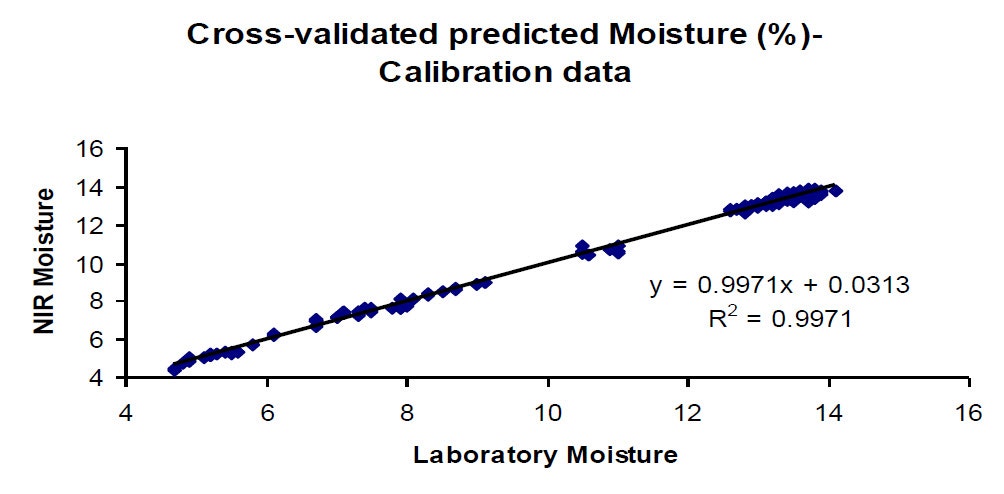
Figure 9: Regression plot for calibration set on Moisture (%)
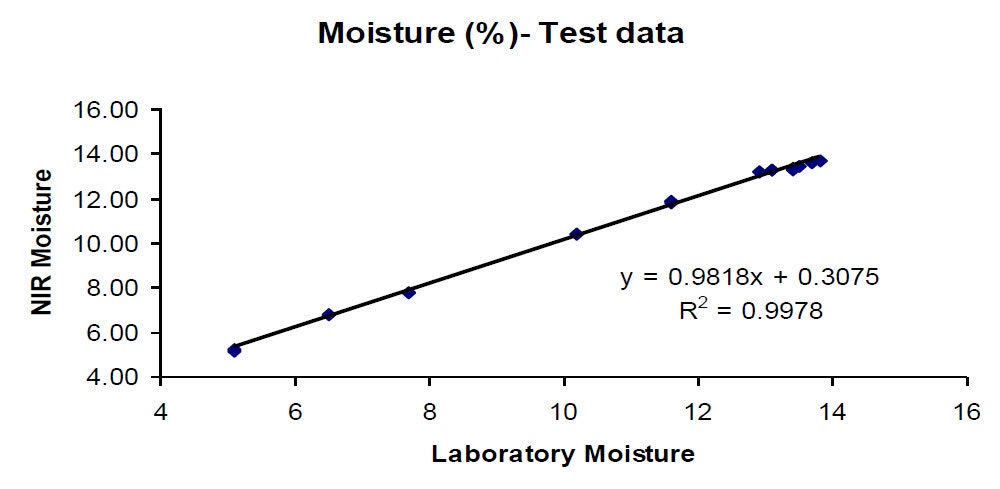
Figure 10: Prediction of test set on Moisture (%) model
An independent test set was used to evaluate and establish the validity of each of the four calibrations. The plots for calibration and test data for Protein and Moisture compare very favorably with each other, indicating that the models are valid. However, there is a higher degree of variation for the Softness (avg.) and Volume (avg.) plot comparison. This variation can be due to several factors. Additional calibration data in the 225-325 range for Softness (avg.) and 3500-4200 for Volume (avg.) could be used in an attempt to improve the RSQ of the models, as those regions are currently under represented in the models.
Initial results obtained for Softness and Volume are encouraging, and additional sample sets from varying production dates/times covering the entire measurement range and the associated primary analytical laboratory data would be highly desirable for both inclusion into the model and for use as independent test sets.
In conclusion, the LS4 (350-2500nm) instrument configuration provided sufficient spectral information to produce functioning calibration models for the determination of Protein, Softness, Volume and Moisture properties in flour samples.