Analytical QbD (AQbD) promises to extend the rigor and benefits of QbD into the area of analytical method development. Here, Paul Kippax provides an introduction to the methodology involved and takes as an example the application of AQbD to the development of a laser diffraction particle sizing method.
Analytical QbD (AQbD) promises to extend the rigor and benefits of QbD into the area of analytical method development. Here, Paul Kippax provides an introduction to the methodology involved and takes as an example the application of AQbD to the development of a laser diffraction particle sizing method.
The application of Quality by Design (QbD) has become second nature to the pharmaceutical industry. The concept of scoping, understanding and controlling a pharmaceutical manufacturing process within the 'design space' is well-established. Alongside this, Process Analytical Technology, most especially on-line measurement, is recognised as playing an important role in delivering the information and understanding to drive QbD, at the pilot scale and through into manufacture.
The FDA have encouraged the adoption of QbD by offering, in return, operational freedom within the design space. This enables a responsive approach to understood but unavoidable variability and can substantially enhance manufacturing efficiency. Such gains prompt the question as to whether the principles enshrined in QbD are applicable to other processes, and analytical method development is now a focus. Just like conventional QbD, analytical QbD (AQbD) holds out the prize of flexibility, in contrast to the rigidity of Standard Operating Procedures (SOPs).
The FDA has already released guidance outlining the potential benefits that this flexibility might bring. The view is that the adoption of AQbD will support the development of robust analytical methods which will more easily transfer with the product, through scale-up, from site to site and indeed from instrument to instrument. This represents a considerable incentive for an industry so heavily reliant on rigorous analysis.
This whitepaper provides an introduction to AQbD and examines how the process of developing and validating analytical methods can benefit from the systematic and scientific approach that QbD promotes. The development of a laser diffraction particle sizing method is used to illustrate the practicalities.
The generally accepted definition of QbD, as presented in International Conference of Harmonization document Q8(R2) (ICHQ8), is: 'A systematic approach to development that begins with predefined objectives and emphasizes product and process understanding, based on sound science and quality risk management'. This central idea of a structured and rigorous approach to the development of a process has resonance in the development of analytical methodologies.
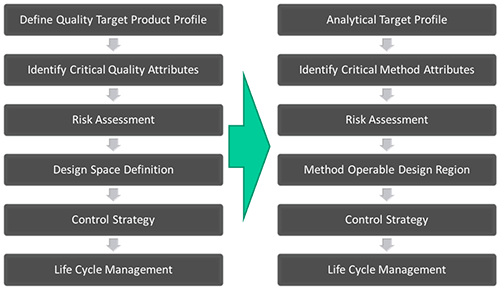
Figure 1 parallels the QbD and AQbD work flow.
|
Conventional QbD begins with the identification of performance targets for the product, the Quality Target Product Profile (QTPP). This usually takes the form of a defined pharmacological or physical feature, such as the dissolution profile and disintegration time for an oral dosage form or bioequivalence to an innovator product. The next step is to identify the attributes and features which deliver the QTTP, the Critical Quality Attributes (CQAs). These are then controlled through knowledgeable manipulation of the Critical Process Parameters (CPPs), which define how the process is operated, and the Critical Material Attributes (CMAs), which are properties of the raw and intermediate ingredients.
For AQbD the starting point is identification of an Analytical Target Profile (ATP). This is the definition of what the analytical method is required to do, which is usually to measure a property that directly affects product quality. This means there is a direct link to the CQAs for a product. For instance, rate of dissolution has a substantial impact on product performance so determining particle size might be necessary to control product quality. Detailed consideration of the ATP identifies the reproducibility and accuracy which must be delivered for the analysis to fulfil its purpose.
The next step in AQbD is to determine an appropriate technique for analysis. Rarely is a measured parameter supplied exclusively by a single technique so the choices available must be considered carefully, with reference to the ATP. Once a technique has been selected, AQbD focusses on building a robust method by identifying critical method attributes and systematically assessing the risks and variability associated with the technique. This systematic study of risk factors may be supported by Design of Experiments (DOE) or Multi-Variate Analysis (MVA) tools and leads to scoping of the 'design space' for the analytical method, the Method Operable Design Region (MODR).
Once an MODR is defined that produces results which consistently meet ATP goals, appropriate methods of control are put in place and method validation carried out following ICH Q2. As with QbD, the entire AQbD workflow is held within a system of 'Life Cycle Management', which implies a process of continuous improvement.
In going beyond simple SOP definitions to create an analytical design space, AQbD enables a responsive approach to the inherent variability encountered in day-to-day analysis, delivering robust methods for use throughout the pharmaceutical life cycle. It also has the potential to reduce the risks involved in analytical method transfer, where the root cause of failure usually stems from insufficient consideration of the operating environment and a failure to capture and transfer the information needed to deliver robust measurement.
The easiest way to understand AQbD is by considering a practical example. A suitable illustration is the application of AQbD in the development of a particle sizing method. Particle size is routinely measured across the pharmaceutical industry and laser diffraction is very often the technique of choice.
'…particle size analysis is not an objective in itself but a means to an end…" - H Heywood Proc, Ist Particle Size Annual conference September 1966
In an industrial setting, particle size is measured because it correlates with properties of a finished product or has an impact on the manufacturing process. To identify an ATP for a particle sizing method it is therefore vital to ask: why is particle size being measured?
To answer this question it is helpful to refer back to the QbD workflow. This enables an understanding of which CMA (solubility or content uniformity for example) or CPP (perhaps powder flowability) it is that particle size analysis is being used to control. This will establish whether or not particle size is a CQA for the product. ICHQ6A is very useful here since it supports a systematic assessment of whether or not a particle size specification is required [ICHQ6A]. This topic is also considered in some detail in 'Method Development for Laser-Diffraction Particle-Size Analysis'[1] but in general a particle size specification should be considered if a pharmaceutical product contains particles and if the size of those particles influences:
If a particle size specification is required then this is the basis for an ATP. However, an ATP should outline not only which variable must be measured, but also why, and which attributes of the measurement - reproducibility and accuracy, for example - will define success. What will make the analytical method capable of meeting its purpose?
Therefore, defining the ATP also requires a consideration of the analytical technique that will be used and the specific metrics it will deliver. Laser diffraction is now the preferred choice for particle sizing in the micron range, in many instances, and is therefore the focus of this AQbD example. A detailed discussion of how to set an appropriate size specification when using laser diffraction is provided in reference [2].
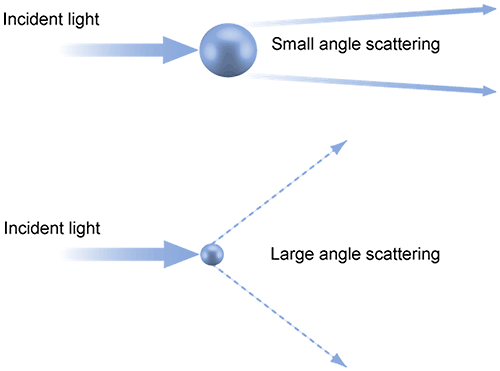
In laser diffraction particle size analysis, the particles in a sample are illuminated by light from a collimated laser beam which is then scattered by the particles present over a range of angles. Larger particles predominantly scatter light with high intensity at narrow angles while small particles scatter more weakly at wider angles. Through the application of an appropriate model, such as Mie theory, a particle size distribution can be calculated directly from the light scattering pattern (Figure 2).
|
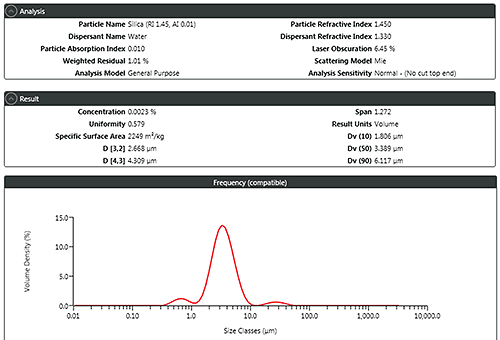
Figure 3 shows a typical report from a laser diffraction analysis highlighting the metrics that the method supplies which can be used to set particle size distribution specifications. The most commonly used values are the percentiles Dv(10), Dv(50), and Dv(90), the size below which 10%, 50% and 90% of the particle population falls respectively, on the basis of volume. Additionally, the mean particle diameters D[3,2] and D[4,3] which are based on surface area and volume respectively may also be used.
|
The ATP identifies what will be measured, for example, Dv(50) and Dv(90) to an accuracy of +/-3%, to meet the stated purpose of the analysis. The next step is to look at what parameters must be controlled to meet this target performance: the CQAs of the method.
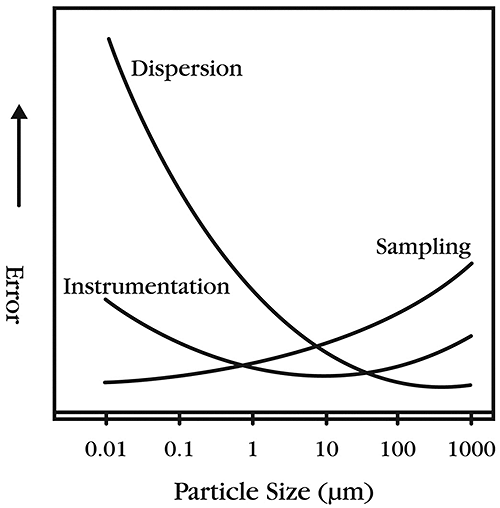
Figure 4 presents the relative potentials for error in particle sizing from three important sources: sampling; instrumentation; and dispersion. It is clear that errors resulting from dispersion and sampling are generally larger than the error associated with the instrument. Both sampling and dispersion are clearly highlighted as CQAs and must therefore be rigorously controlled.
|
The control of sampling begins with extracting the sample from the bulk, but extends through the analytical method to measurement time, which reflects how much of a gathered sample is actually analyzed. When it comes to dispersion it is vital to refer back to the ATP to identify the purpose of the measurement. For instance, if the goal is to understand powder flowability then measuring the sample in its agglomerated state may give more relevant information. On the other hand if the intent is to control clinical features, such as solubility or bioavailability, then dispersing the material to its primary size is more beneficial.
In most cases primary particle size is the parameter of interest, and dispersion forms part of most laser diffraction analyses. Here there is a choice to be made between dry and liquid dispersion.
Liquid dispersion uses a wetting agent to reduce the forces of attraction between particles, and dispersion is induced by stirring and/or sonication. The use of a liquid dispersant makes this technique more complex and less environmentally favourable than dry measurement, especially for samples that are sensitive to water, the preferred dispersant. However, wet dispersion is both gentle and effective and therefore is well-suited to fragile and friable samples that are prone to breakage/damage. It is also the dispersion method of choice when working with compounds where exposure needs to be tightly controlled.
Dry dispersion, a more physically intense process, involves entraining samples within a high-velocity air stream. Dispersion results from collisions between particles and/or between particles and a surface and the shear stress induced by the rapid acceleration and deceleration of particles (see Figure 5). The advantages of dry dispersion are simplicity, speed and low environmental impact.

|
Ensuring complete dispersion, either wet or dry, is an essential element of laser diffraction analysis. This makes the parameters that control dispersion CPPs for the laser diffraction method - variables that directly impact data quality. The following sections outline how to scope the MODR for either wet or dry dispersion but clearly either one or the other of these will be followed in a typical AQbD project, rather than both.
In summary the development of a wet dispersion method involves:
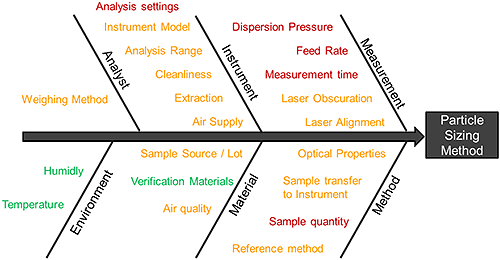
Figure 6 shows a 'fishbone' risk assessment that summarises all the potential sources of variability that impact a wet method. Risk factors fall into three distinct groups: noise factors (green), control factors (orange) and experimental factors (red). It is the experimental factors that require systematic investigation to determine the MODR for the analytical method. The following experimental examples show how this can be achieved.
|
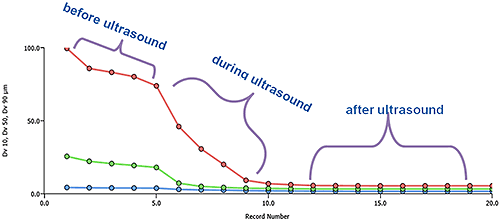
Figure 7 shows the results from an experiment to investigate the effect of sonication on sample dispersion. Particle size is clearly reduced by sonication but there is an appreciable time taken to reach stability, a phenomenon that must be reflected in the developed method.
|
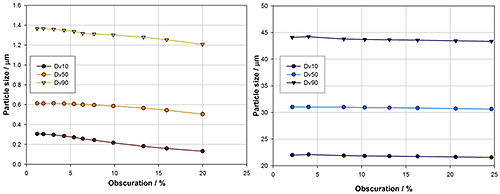
Figure 8 shows data from experiments investigating the impact of laser obscuration, which is often taken as a measure of sample concentration. In a laser diffraction measurement sample concentration must be high enough to overcome background noise but not so high as to induce multiple scattering, where light scattered from one particle interacts with another particle before reaching the detector.
Laser diffraction systems do not directly report sample concentration. Instead users add sample to achieve a certain level of obscuration, which is the percentage of light intensity that is attenuated through absorption or multiple scattering by the particles, during measurement. However, obscuration depends not only on particle concentration, but also particle size. Achieving a specific obscuration with fine particles requires a much higher sample concentration than with larger particles because of the increase in scattering efficiency that occurs as particle size reduces.
|
The results from this experiment reflect these effects. For the sample containing larger particles, the reported particle size is independent of sample concentration. However for fines, a reduction in the reported particle size is observed above 4% obscuration. At this point the sample concentration is so high that multiple scattering has begun to occur. With these finer particles a relatively low obscuration is required to approach the robustness achieved with the coarser sample.
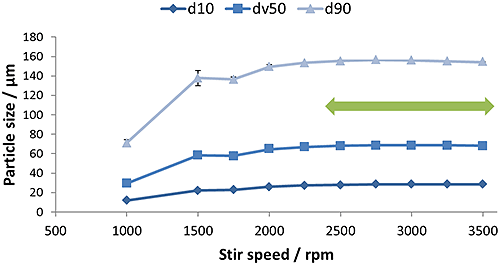
Figure 9 shows the results of stirrer speed titration, an assessment of the impact of stirrer speed on measured particle size. Above 2500 rpm, particle size is stable indicating that the whole sample is in suspension. Below this speed, larger particles are settling and fine particles are being sampled disproportionately.
|
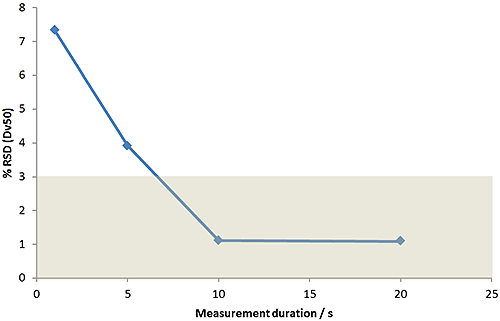
Figure 10 shows the results of an experiment to assess the impact of measurement time. If the duration of measurement is too short, then larger particles that are present in small numbers might be missed. For samples with broad distributions, measurement duration is especially important. These results show that measurement times in excess of 10 seconds provide consistent data in this case.
|
In summary the development of a dry dispersion method involves:
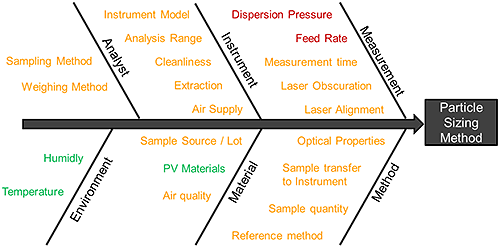
Figure 11 shows a 'fishbone' risk assessment of all the factors that can impact dry measurement and as before it is the experimental factors, highlighted in red, that must be explored via experimental work.
|
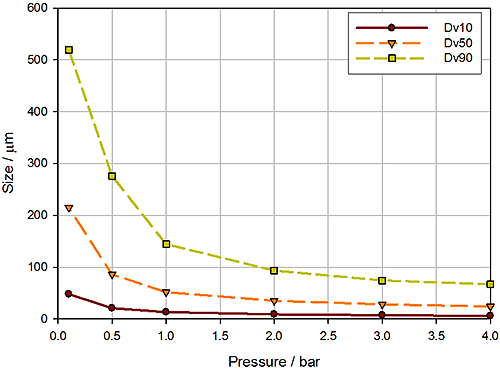
In dry powder dispersion the air pressure applied during entrainment of the sample is the lever used to control the input of energy into the dispersion process and, subsequently, the extent to which the sample is dispersed. Figure 12 shows a pressure titration, a plot of reported particle size as a function of dispersion pressure, for a crystalline powder, measured using a high-energy disperser.
|
This graph indicates that a stable particle size is achieved at pressures in excess of around 2 to 2.5 bar. However, a parallel wet dispersion showed that comparable particle size data were reported by the two methods using a dispersion pressure of just 0.2 bar. At 0.2 bar the gradient of this plot is noticeably steep, suggesting that small changes in pressure will lead to significant changes in particle size. This indicates a very narrow operating range and suggests that a method based on these conditions may not be robust.
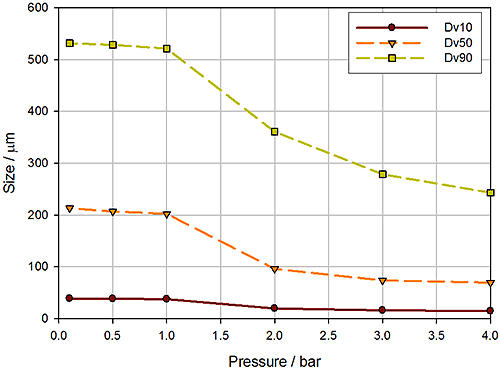
Figure 13 shows a pressure titration using a lower energy disperser, with a different geometrical design. Here robust results, comparable to those obtained via wet measurement, are reported over a wider pressure range (0 - 1.0 bar) indicating a fundamentally more robust method than when using the higher energy disperser, and a wider MODR.
|
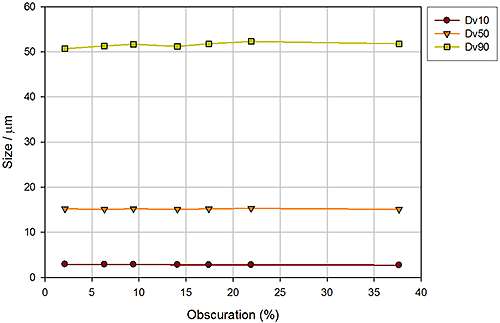
Figure 14 shows the results from an experiment to investigate the impact of feed rate, monitored in the form of obscuration (sample concentration). Sample feed rate determines the amount of material that passes through the disperser and therefore impacts dispersion efficiency. Too low a feed rate may lead to 'noisy' results while an excessively high feed rate my overload the venturi, inhibiting its performance. These data show a system that is not sensitive to feed rate, since reported particle size results are independent of obscuration.
|
The final step in the AQbD process is to ensure that the necessary control is in place, that the method is validated.
USP<1225> [3] and the FDA's latest Guidance for Industry for Analytical Procedures and Methods Validation [4] both provide a list of analytical validation characteristics which should be considered when validating physical property methods. Stress is laid on a case-by-case assessment of the characteristics which should be considered, with the goal of determining that the procedure is suitable for use. USP<1225> goes on to specify a generic approach for selecting the appropriate characteristics based on the category in which the technique in question falls, with the main characteristic for particle size analysis being precision. However, the specific use of the method and the characteristics of the material being analysed should be taken in to consideration before defining the most appropriate characteristics. These reference back to the ATP.
Both USP <429>, the USP general chapter relating to laser diffraction methods [5], and USP<1225> specify the importance of accuracy assessment to ensure optimum equipment performance prior to carrying out methods validation, and guidance is provided on how this should be achieved using standard reference materials. USP<429> also suggests that the sample concentration range should also be considered, so as to ensure that the measured particle size distribution is not affected by changes in concentration within the concentration range specified for the method. Concentration range definition should be assessed on a case by case basis and will be highly dependent on the nature of the sample and the type of method being validated.
Considering the method validation process, the following should be considered in confirming that a particle sizing method is fit for purpose:
Assessing precision involves seven measurements of the same sample. It therefore tests the consistency of the sampling and dispersion process. Intermediate precision is then assessed by considering different operators. Reproducibility is a broader concept that also encompasses multiple analytical systems, possibly across multiple laboratories on different company sites. The method robustness is defined with reference to the risk assessment stage of the AQbD process.
USP<429> and ISO13320:2009 provide guidance as to the precision (repeatability) and reproducibility that particle sizing should deliver. However the specifications are relatively broad and far closer tolerances may be set where necessary. At this point it is crucial to ensure that the precision and reproducibility match the requirements of the ATP rather than simply answer to regulatory guidance, since ultimately this will determine the success of the analytical technique across the lifetime of the product.
Precision is assessed by running the developed method a number of times on the same sample. Table 1 shows the results from this type of experiment, with the analyses conducted by a single operator.
| Sample Number | Dv10 / mm | Dv50 / mm | Dv90 / mm |
|---|---|---|---|
| 1 | 1.22 | 23.68 | 63.23 |
| 2 | 1.17 | 23.77 | 60.02 |
| 3 | 1.09 | 22.79 | 56.59 |
| 4 | 1.16 | 23.63 | 62.55 |
| 5 | 1.11 | 22.26 | 59.68 |
| 6 | 1.18 | 22.78 | 65.36 |
| 7 | 1.12 | 23.41 | 61.47 |
| Mean | 1.15 | 23.19 | 61.27 |
| COV (%) | 3.95 | 2.50 | 4.63 |
In accordance with USP guidance more than six measurements are performed. The Coefficient of Variation (COV) is found to be within USP limits, with the slightly broader spread of results for the Dv10 and Dv90 bring attributed to dispersion and sampling respectively. Table 2 shows the results recorded when a different operator conducts the same series of analyses.
| Sample Number | Dv10 / mm | Dv50 / mm | Dv90 / mm |
|---|---|---|---|
| 1 | 1.06 | 22.92 | 61.01 |
| 2 | 1.08 | 22.08 | 56.54 |
| 3 | 1.04 | 21.66 | 62.17 |
| 4 | 0.97 | 22.55 | 60.23 |
| 5 | 1.04 | 22.74 | 57.98 |
| 6 | 0.99 | 23.58 | 59.86 |
| 7 | 0.95 | 22.11 | 62.78 |
| Mean | 1.02 | 22.52 | 60.08 |
| COV (%) | 4.79 | 2.83 | 3.69 |
COV is again within the limits set by USP guidance. Performing the measurement a number of times with a range of different operators scopes the impact of operator variability and enables calculation of the intermediate precision, by pooling all of the results. Once precision has been validated to an acceptable level, attention can then turn to testing reproducibility, the precision of the method when used with fresh samples prepared by a different operator for example, or at different laboratories [6] to complete the validation process.
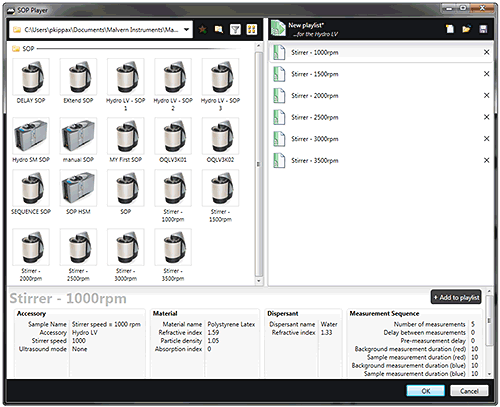
Recent advances in analytical instrumentation, and associated software, can make a big difference when it comes to the application of AQbD. For example, some laser diffraction systems (such as the Mastersizer 3000, Malvern Instruments) have SOP Player functions, which allow method development or validation testing to be automated. Using this tool, users can build measurement sequences around existing SOPs to enable rapid experimentation. Figure 15 shows an SOP sequence for stirrer speed that illustrates this approach. Such a sequence could be used to efficiently conduct a stirrer speed titration as part of scoping the MODR, but is also helpful during validation testing.
|
Another application of this tool is in setting up SOP sequences where users need to measure a sample in different states of dispersion as part of a measurement sequence, such as measuring the sample before and after sonication. Just like standard SOPs, these sequences can be saved and then recalled.
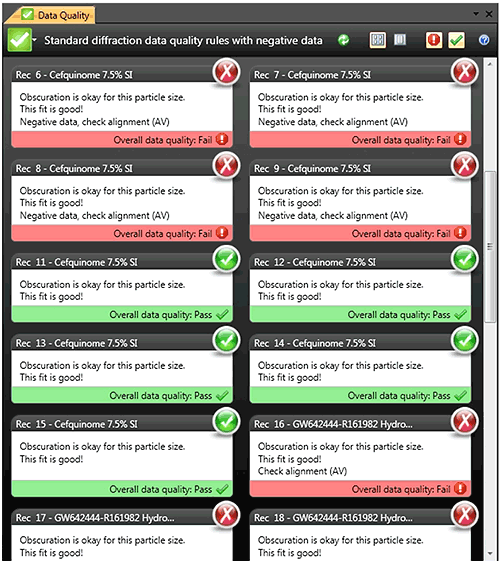
Modern particle sizing systems also offer tools to continuously monitor data quality. Malvern's Data Quality tool for the Mastersizer 3000, for example, enables operators to critically assess measurement data and results during an analysis. Figure 16 shows the output from this software. Advice is given relating to the measurement process (e.g. instrument cleanliness and alignment) and also the analysis process (e.g. the goodness of fit between the light scattering data acquired by the instrument and the optical model selected to calculate a size distribution from these data). The net result is to deliver Malvern expertise directly at the point of analysis in a way that that makes it possible to detect measurements that may be out of specification, and also to obtain the advice needed to optimize SOPs.
|
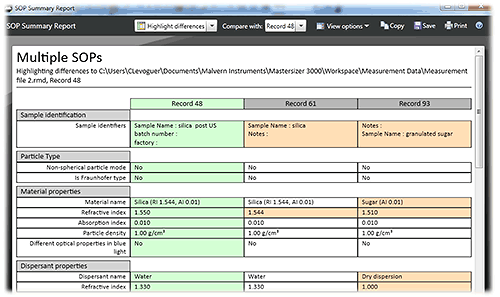
Review tools are also available to help with checking that methods are used correctly. One requirement for QC labs is to allow an audit of the method settings applied in the creation of results. This can be achieved using the SOP Summary Report within the Mastersizer 3000 software, which allows the SOP settings for multiple records to be compared and, if required, to highlight the differences between SOP settings. By doing this, the root cause of any differences in results relating to the applied measurement settings can be identified immediately.
|
Laser diffraction is a well-established and highly automated technique. Arguably, tools that support the implementation of AQbD may be more advanced in this area than elsewhere. However, other instrumentation increasingly offers functionality that can be very helpful in AQbD. SOP-driven operation is now routine in dynamic light scattering systems, for example, and Malvern's Zetasizer Nano family also benefits from a data quality tool. Even in the field of rheology the latest systems, as exemplified by the Kinexus rotational rheometer (Malvern Instruments), are advancing SOP-driven operation, a valuable asset in AQbD related studies.
More than a decade ago Malvern Instruments broke new ground by delivering standard operating procedure-driven analysis in the Mastersizer 2000, helping to bring robust and reliable analysis to the pharmaceutical industry. Today, with the benefit of QbD experience, the strict adherence to SOPs has rightly been identified as an overly rigid approach to analysis. The advent of AQbD brings the promise of flexibility and an associated easing of method transfer that will ensure analytical methods are efficient and robust, and useful throughout the lifetime of an analytical product.
| QbD | Quality by Design – A systematic approach to development that begins with predefined objectives and emphasizes product and process understanding, based on sound science and quality risk management. |
|---|---|
| AQbD | Analytical Quality by Design – The development of analytical methodologies in such a way as incorporates the principles of Quality by Design. |
| ATP | Analytical Target Profile – Defines the goal of the analytical method development process. Directly analogous to the Quality Target Product Profile (QTPP) within conventional QbD. |
| CQA | Critical Quality Attributes – Attributes of analysis or a product that must be controlled to ensure the ATP or QTPP is met. |
| CPP/CMA | Critical Process Parameters/Critical Material Attributes – Parameters of a process, product or analytical methods that control the CQAs. |
| MODR | Method Operable Design Region – The ‘design space’ for the AQbD methodology. Defines the operating range that produces results that consistently meet the ATP. |
| DOE | Design of Experiments – A systematic experimental approach adopted to define the MODR. |