This technical note describes how Nanoparticle Tracking Analysis (NTA) is used to analyze the size and concentration of particles from the light they scatter, and how it can be used to detect fluorescence which is emitted naturally by particles or as a result of fluorescence labeling or tagging.
Nanoparticle Tracking Analysis (NTA) technology from Malvern can be used to analyze the motion and concentration of particles from the light they scatter. In addition, with appropriate experimental design, NTA may also be used to detect fluorescence which is emitted naturally by particles or as a result of fluorescence labeling or tagging.
This technical note discusses the process of fluorescence detection in NTA and the considerations necessary for a researcher hoping to exploit fluorescence in their research.
Fluorescence labeling can be utilized in any situation where it is necessary to distinguish a particular subset of particles within a complex background. Some examples where fluorescence labeling may be useful include drug delivery nanoparticles, small biological particles such as extracellular vesicles, and virus particles or virus like particles (VLPs). The type of labeling used will be dependent on the type of particle to be labeled and the experimental objectives.
In the case of drug delivery nanoparticles, it is possible to fluorescently tag or load these particles and distinguish them within a complex medium, such as mucin. The mucin itself is highly complex, containing particles that would be seen in large numbers under light scatter mode, making it impossible to see or track the small drug delivery nanoparticles. By fluorescently tagging or loading them, it is possible to insert a specially selected filter to remove the scattered light and allow only the longer wavelength emission from the fluorescently labeled particles to be imaged and measured.
Particle labeling can be very specific, for example using antibody labeling to specifically target a known marker on a particle of interest within a mixed sample. This type of labeling is often useful when studying small biological particles such as exosomes or microvesicles.
Labeling may be less specific, i.e. targeting all lipids, proteins, or sugars within a sample, using a dye that has an affinity for one of these. Sometimes the dye is only ‘switched on’ when it becomes attached to the molecule of interest, as, for example, some lipid membrane dyes.
Criteria for choosing an appropriate fluorophore:
| Available Laser Wavelengths (nm) | Standard Filter Supplied (nm) |
|---|---|
| Violet 405 | 430 long pass |
| Blue 488 | 500 long pass |
| Green 532 | 565 long pass |
| Red 642 | 650 long pass |
Photobleaching occurs when a fluorophore permanently loses the ability to fluoresce due to photon-induced chemical damage or covalent modification. Photobleaching is not well characterized, but can result in a dramatic loss in the fluorescence emission intensity, and a subsequent reduction in the ability to perform accurate sample analysis with the NanoSight system.
Using a synchronization cable and syringe pump can significantly reduce the problem of photobleaching during sample analysis, and further increase the accuracy of particle concentration measurement and sizing when operating in fluorescence mode.
The synchronization cable, which is fitted to high sensitivity systems, is used to pulse the laser in synchrony with the camera shutter, thus limiting the exposure time of the fluorophore to the illumination source, thereby slowing down the process of photobleaching.
The syringe pump further improves the accuracy of fluorescence measurements by enabling a constant supply of fresh sample to be flow through the sample chamber at a speed faster than the bleach rate of the fluorophore. Malvern recommends the use of the syringe pump for all fluorescence measurements.
| Fluorophore | Excitation Max (nm) | Emission Max (nm) | Brightness (1-5) | Overall | Sample Type |
|---|---|---|---|---|---|
| Alexa 488 | 495 | 519 | 5 | +++ | Exosomes, Microvesicles |
| Spyro Red | 550 | 630 | 5 | +++ | General Protein Dye |
| Rhodamine-PE | 560 | 590 | 5 | +++ | Lipids |
| EGFP | 488 | 509
|
4 | +++ | Exosomes, Microvesicles |
| DiO | 484
|
501
|
3 | ++ | Lipids |
| Alexa 546 | 556 | 573 | 3 | ++ | Silica |
| Alexa 647 | 650
|
668
|
3 | ++ | Exosomes, Microvesicles, Viruses |
| FITC | 490 | 525 | 2 | + | Exosomes |
| Fluorophore | Excitation Max (nm) | Emission Max (nm) | Brightness (1-5) | Overall | Sample Type |
|---|---|---|---|---|---|
| ICG | 790 | 800 | 1 | - | Gd02 + Polymer |
| DiR | 750/650 | 790 | 1 | - | Gd02 + Polymer |
| V450 | 404 | 488 | 0 | - | Microvesicles |
| Pacific Blue | 401 | 452 | 0 | - | Exosomes, Liposomes |
To achieve optimum signal to noise ratio, try varying the concentration of fluorescent label to sample particles:
Adding large quantities of fluorescent label will not necessarily result in better labeling:
It is better to label particles at a high concentration and then dilute after labeling (immediately prior to analysis):
Prior to carrying out a fluorescence measurement it is necessary to dilute the sample to an optimum concentration for NTA. The dilution factor is best worked out by preparing a serial dilution of your sample, for example: 10x, 100x, 1000x, 10,000x. This should first be checked in scatter mode, by loading the most dilute sample into the chamber and then gradually loading in more concentrated sample until you reach the optimum concentration for analysis.
Once an optimum dilution for measurement in scatter mode has been determined, the sample can be checked in fluorescence mode. If no signal is seen, continue to inject sample at a higher concentration until fluorescent particles become visible. It is not uncommon to run fluorescence measurements at a much higher concentration than scatter measurements.
Prior to sample analysis:
If using the syringe pump, open the syringe pump control, connect the syringe pump and flow the sample at the recommended speed for the instrument (Table 3). All measurements using the syringe pump should be carried out in scatter and fluorescence mode at the same flow speed for comparison of results.
| Laser Module Top Plate Style | Recommended Flow Speed |
|---|---|
| LM10-T14 (LM14) | 50-80 |
| LM10 (LM12) | 20-50 |
| NS300 "O" ring (metal) | 50-80 |
| NS300 flow-cell | 20-50 |
| NS500 | 20-50 |
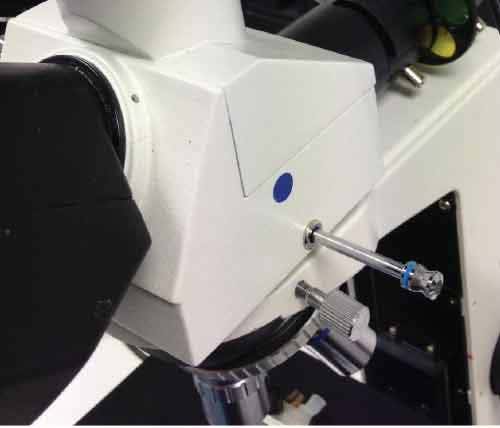
LM10 instrument - insert silver lever on right hand side of microscope optical head to put the fluorescence filter in (Image 1). The filter will be on the right hand side. Where two filters have been fitted, one filter will be on the left hand side, below the lever which switches between the microscope oculars and the camera. Note, there will be a colored dot next to the lever indicating that a filter has been fitted.

|
NS300 instrument - under the Hardware camera menu item, select the relevant filter position for your system (default is filter 2).
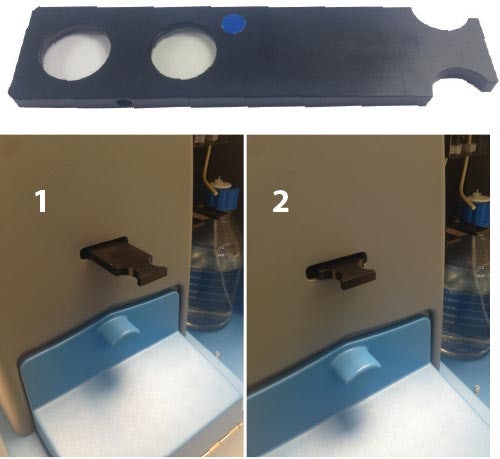
NS500 instrument - first check the position of the fluorescence filter in the filter holder, it will be indicated by a colored dot. Either push in or pull out the filter holder until it clicks into position - the direction of movement will depend on the position of the filter in the holder (Image 2).

|

|
Misinterpretation of results is common with fluorescence measurements. To prevent the incorrect interpretation of results it is necessary to run several controls, depending on the labeling method used. All preparation steps should be checked in both scatter and fluorescence mode to enable the user to best understand the results (see Table 4).
| Sample | Scatter Mode | Fluorescence Mode |
|---|---|---|
| Sample diluent* alone | Check for particles & filter if necessary/possible | Check for fluorescence either as individual particles or a background haze brighter than water alone |
| Unlabeled sample in diluent | Check particle size and concentration for comparison with labeled sample data | Check that sample does not fluoresce, and that there is no bleed of scatter through the filter (possible with very high intensity particles) |
| Fluorescent probe in diluent** | Check that there are no large particles/aggregates seen & filter if necessary/possible | Check fluorescence is seen as a flickering background haze, but no large particles seen that could be mistaken for labeled sample particles |
| Labeled sample in diluent | Check particle size and concentration for comparison with unlabeled sample data and labeled sample fluorescence data | Check particle size and concentration for comparison with scatter |
| Sample | Scatter Mode | Fluorescence Mode |
|---|---|---|
| Sample diluent* alone | Check for particles & filter if necessary/possible | Check for fluorescence either as individual particles or a background haze brighter than water alone |
| Unlabeled sample in diluent | Check particle size and concentration for comparison with labeled sample data | Check that sample does not fluoresce, and that there is no bleed of scatter through the filter (possible with very high intensity particles) |
| Primary antibody in diluent** | Check that there are no large particles/aggregates seen & filter if necessary/possible | Check no fluorescence is seen |
| Secondary antibody in diluent** | Check that there are no large particles/aggregates seen & filter if necessary/possible | Check fluorescence is seen as a flickering background haze, but no large particles that could be mistaken for labeled sample particles*** |
| Primary + secondary Ab in diluent** | Check that there are no large particles/aggregates seen & filter if necessary/possible | Check fluorescence is seen as a flickering background haze, but no large particles that could be mistaken for labeled sample particles*** |
| Sample + primary Ab*** | Check particle size and concentration - should be the same as sample alone | Check no fluorescence is seen |
| Labeled sample in diluent | Check particle size and concentration for comparison with unlabeled sample data and labeled sample fluorescence data | Check particle size and concentration for comparison with scatter |
If a fluorescent signal is seen in diluent (this can be seen with serum in some laser wavelengths), or any other part of the sample preparation where you would not expect to see fluorescence:
If large particles are seen in the fluorescent probe or secondary antibody when the fluorescence filter is inserted:
If a high fluorescence background is seen in a labeled sample preparation, but no labeled particles are seen: