The latest advances in integrating XRF technology enable bulk analysis together with small spot analysis and element mapping on a single platform. The ability to analyze small areas, or map the distribution of elements on a fine scale, widens the range of applications possible for fundamental investigations in production control and materials research.
Conventional X-ray fluorescence (XRF) spectrometry is a commonly used analytical method to establish the bulk elemental composition of a wide range of materials in both manufacturing and R&D. It is used for process monitoring and final quality control in a variety of industries, ranging from petrochemicals, mining, building materials to metals. Bulk XRF analysis requires homogeneous samples, and spectrometers configured for this type of analysis are not normally suited to analyze heterogeneities and very small areas of the sample.
Conventional X-ray fluorescence (XRF) spectrometry is a commonly used analytical method to establish the bulk elemental composition of a wide range of materials in both manufacturing and R&D. It is used for process monitoring and final quality control in a variety of industries, ranging from petrochemicals, mining, building materials to metals. Bulk XRF analysis requires homogeneous samples, and spectrometers configured for this type of analysis are not normally suited to analyze heterogeneities and very small areas of the sample.
The latest advances in integrating XRF technology enable bulk analysis together with small spot analysis and element mapping on a single platform. The ability to analyze small areas, or map the distribution of elements on a fine scale, widens the range of applications possible for fundamental investigations in production control and materials research.
In the Zetium XRF spectrometer, SumXcore combines wavelength dispersive(WD) XRF and energy dispersive (ED) XRF technology, resulting in a much wider range of possible applications. Using the ED core for small spot analysis has a number of benefits, which apart from the high speed of data acquisition, also leaves the performance of the WD core uncompromised for high accuracy and precision routine bulk analysis. In contrast to other elemental mapping techniques, for example, scanning electron microscopy or electron microprobe analysis that involve quite complex sample pre- treatments, XRF requires little or no sample preparation. This means that element mapping becomes a straightforward task accessible to users of varying levels of skill and allows it to become an indispensable tool in scientific research and process troubleshooting.
The ED core enables fast, simultaneous, multi-element analysis per analysis spot, which is a distinct advantage over spectrometers that employ small spot analysis along a sequential wavelength dispersive optical path. In addition to simultaneous multi-element data acquisition, close coupling of the ED core to the sample also gives unrivalled sensitivity, further enhancing measurement throughput. Collecting spectra and identifying elements across almost the entire periodic table in a single spot measurement is ideal for element mapping and inclusion studies, particularly when the composition of the sample is unknown.
A Zetium spectrometer, configured with a 4 kW SST R-mAX tube, an improved X-Y sample handler for faster sample throughput and advanced analytical software was used to produce the data presented in this application note.
To enable the small spot analysis and mapping capability, the spectrometer was equipped with an ED core, high- precision turret translation mechanics for sample positioning and a high- resolution camera for sample imaging. Our latest release of SuperQ allows easy application setup and the production of 2D images, while the straightforward export of data to third-party image manipulation software, allows the production of 3D contoured images.
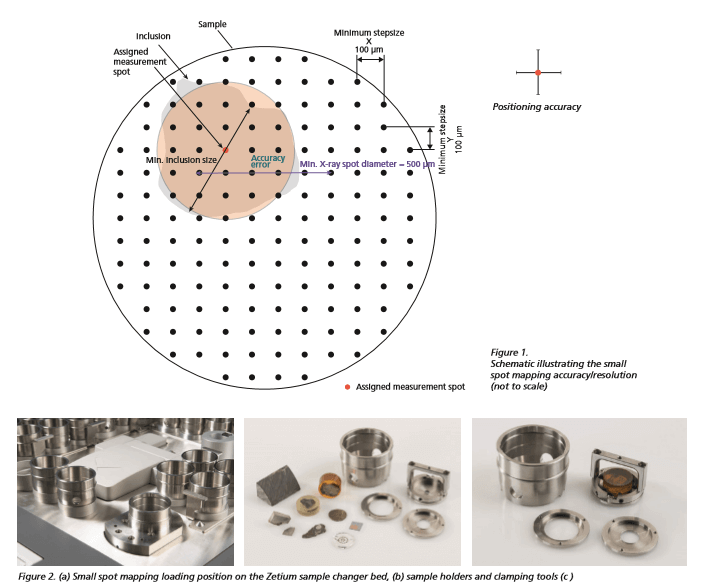
The small spot analysis and mapping module can accommodate samples with diameters up to 35 mm. The measurement spots have a diameter of 500 μm (FWHM) and a minimum intervening step size < 100 μm (Figure 1), resulting in a maximum of 24,000 spots per sample.
Sample preparation is simple and samples are mounted in a dedicated holder, specially designed for irregularly shaped samples of varying size (Figure 2). This holder incorporates a sample clamping device, ensuring that small samples can be placed into the instrument without compromising positioning accuracy or damaging the sample
Small spot analysis and mapping is an ideal tool for the investigation of a wide range of materials. In this application note a range of applications is presented to illustrate the performance of the Zetium XRF spectrometer.
It is possible to set up either qualitative (intensity-based) or quantitative (concentration-based) applications. Quantitative applications can be either conventionally calibrated applications for simple inclusion analysis or more complex multi-element distribution analysis for a wide variety of sample types. Moreover, the multi-element acquisition mode of the ED core makes semi-quantitative Omnian applications possible, with all of the usual advantages of standardless analysis.
Stainless steel calibration
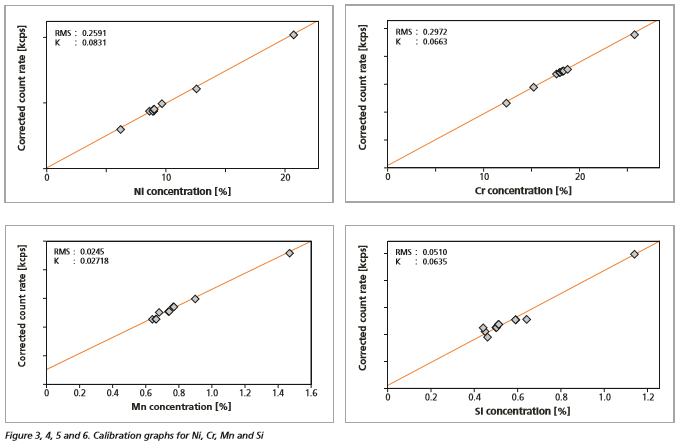
Small spot analysis was used to build a conventional calibration using eight international certified reference materials (CRMs) for stainless steel (series SS 461-468). Measurement conditions used are reported in Table 1 and calibration graphs for Mn, Si, Ni and Cr are shown in Figures 3-6.
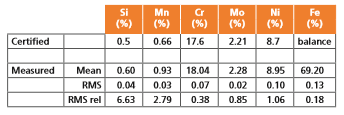
A certified reference material was measured as an unknown against the calibration. The results after only 100 seconds measurement time show excellent agreement with certified values, as reported in Table 2.
Table 1. Conditions used for small spot analysis using the ED core

Table 2. Comparison between certified and measured values including RMS for ten consecutive measurements of a certified reference material measured as unknown
Quantitative applications
Compositional mapping of a meteoritic sample
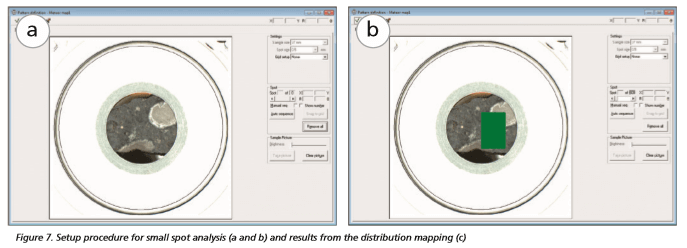
In this study the distribution of a variety of elements was mapped in a chondritic meteorite sample (type CV3), with calcium-aluminium-rich inclusions. The meteorite sample was initially mounted in the special sample holder and imaged using the high-resolution camera (Figure 7a). The sample was then loaded into the measurement position and the SuperQ software was used to identify features and areas on the sample to be analyzed (Figure 7b).
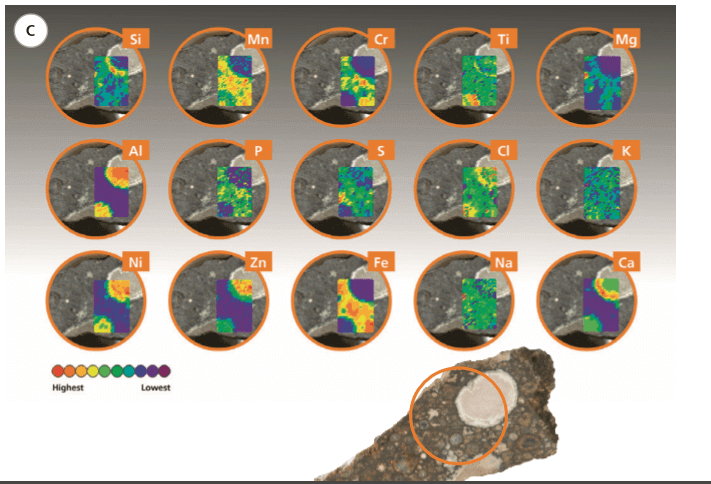
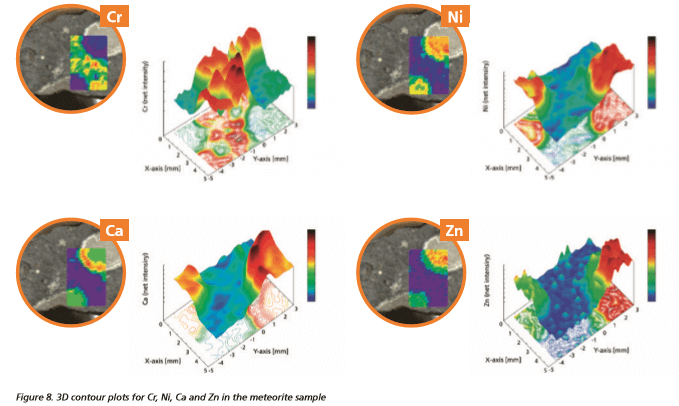
For the analysis of the meteorite sample, an area of 5 mm x 7.5 mm was selected and mapped using a total of 600 spots. Each spot was measured for 60 seconds, giving a total measurement time of 10 hours. Images showing the distribution and relative concentration of 15 elements from the analyzed area clearly show compositional differences between the host matrix of the sample and the Ca-Al-rich inclusions (Figure 7c). The Cr, Ni, Ca and Zn distributions are also represented in 3D contour plots using Gnuplot software (Figure 8).
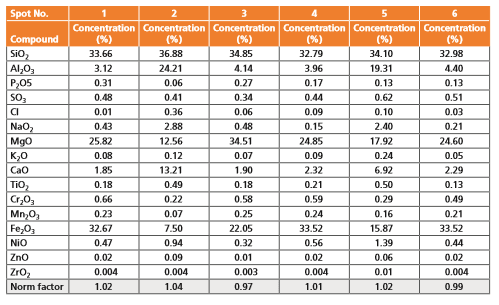
Six different spots located across the sample surface were selected (Figure 9) and measured in order to demonstrate the quantitative capabilities of the small spot analysis. Results shown in Table 3, reveal the expected differences in elemental composition, with Al, Mg, Ca and Fe showing the biggest variations corresponding to different mineral phases.
Results were normalized giving a norm factor of approximately 1, demonstrating that the FP algorithm is able to successfully handle matrix variations within the sample application and deliver compositional values matching real concentrations.
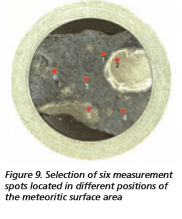
Table 3. Element composition correspondent to 6 different measurement spots shown in Figure 9.
Compositional mapping of a steel sample
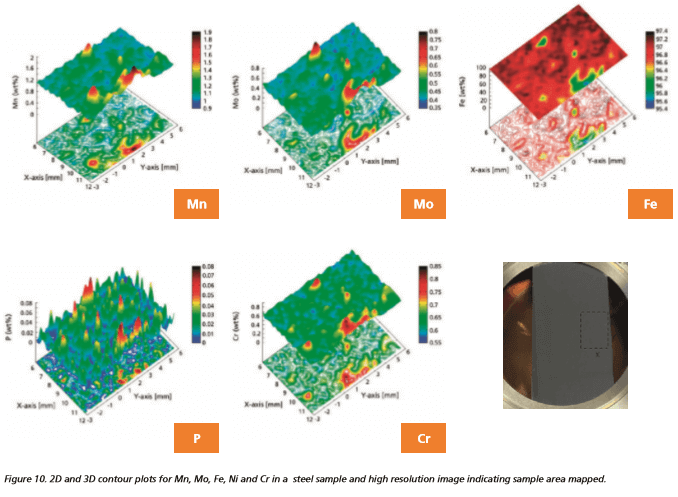
In this study the distribution of nine elements was mapped for a steel sample checked for quality control purposes. The steel sample was initially mounted in the special mapping sample holder and imaged using the high-resolution camera (Figure 2) to identify features and areas on the sample to be analyzed (as illustrated in Figure 7). It is important to note that the sample surface did not show heterogeneities visible to the eye.
For the analysis of the steel sample, an area of 5.75 x 8.75 mm2 was selected and mapped using a total of 864 spots. Each spot was measured for 100 seconds, giving a total measurement time of 27.4 hours. The elemental distribution of only five critical elements was reported, showing their relative concentration. Images show compositional differences not expected at this scale (Figure 10). The elemental distribution of Fe appears to be homogeneous over the entire surface analyzed except for on the edge of the mapped area where it shows decreasing concentration, corresponding to an increase of concentration for Mn, Mo and Cr, suggesting a coupled substitution between those elements and Fe. This application shows the potential impact of performing practical compositional mapping at production control, where results can contribute to tremendously improving the manufacturing processes.
Qualitative applications
Analysis of an archeological coin
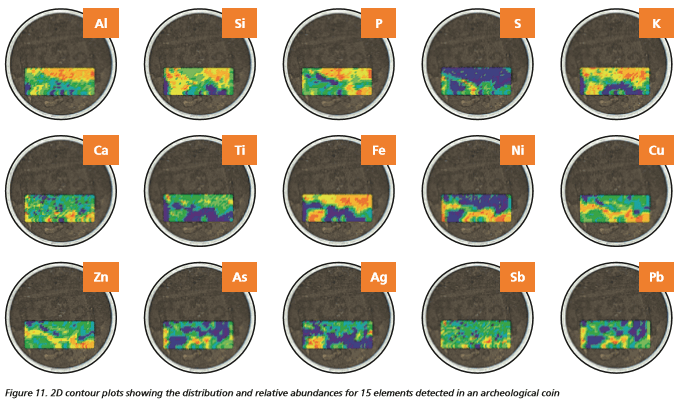
In this study, a coin found in the region of Overijssel (the Netherlands) and dating back to the 19th century, was analyzed using qualitative intensity-based element mapping. The coin was carefully clamped and mounted in the sample holder. A 10 mm x 3.75 mm area of the sample surface was mapped, using a total of 600 spots with an intervening step size of 250 μm. Each spot was measured for 80 seconds, giving a total measurement time of 13.3 hours. Figure 11 illustrates the distribution and relative sensitivities of 15 elements within the analyzed area. Clear compositional differences are evident between the inner and outer part of the coin, suggesting that the coin surface was altered as a consequence of the interaction with the earth in which it was burried.
The 2D images show that the substrate is enriched with Ni and Cu, while the altered outer part is more enriched with Ti and Fe. Moreover, images show the presence of heavy metals in high concentrations (e.g. As and Pb), suggesting the inability of
separating these elements during metal production. The elemental composition of the coin can help in reconstructing the origin of the metal used to forge it, as well as the provenance of the ores used in the metal smelting and can ultimately help identify trade routes.
Small spot analysis with element distribution mapping by XRF is an ideal tool for materials research and production process troubleshooting. It makes a valuable addition to a bulk sample analysis spectrometer. Data presented in this application note demonstrate that the Zetium with SumXcore technology is capable of performing fast, accurate and precise analysis on small sample areas. Contributing to a better understanding of material compositional characteristics, this functionality is now brought out of research facilities and closer to where routine analyses are performed.