Powder coatings are increasingly used as an alternative to paint on metal surfaces, especially when increased surface toughness is required. A thermoplastic or thermosetting polymer in dry powder form is applied electrostatically to the metal surfaces using a spray gun. The coated piece is then cured to partially melt the powder to form a thin layer of plastic over the surface. As there is no carrier fluid, unlike paint, there are no volatiles given off, so the process is more environmentally friendly than traditional painting. Since the coating is applied electrostatically, gravity is of minor importance and even coatings can be applied to horizontal and vertical pieces in one pass, without drips and runs forming. Powder coatings are available in a range of chemistries and with different mechanical properties, corrosion resistance and curing regimes; these include polyester, polyurethane, epoxy and epoxy-polyester hybrid powders.
To produce a consistent coating the powder must be free-flowing and have a controlled particle size distribution. Problems in the surface finish can be caused by small proportions of large particles which may be visible as lumps in the surface finish. In higher proportions, an “orange peel” effect may become apparent. This occurs when the coating is too thick in some areas, creating a surface finish similar to orange peel. A small degree of orange peel effect is preferred in many applications as it reduces the appearance of fingerprints on the surface, but too much is considered to be undesirable, indicating poor application and wasted powder. If too many fines are present, there can also be problems with powder flow and fluidization in the spray gun. Again these would lead to poor application and, in some cases, increased orange peel effect, as well as practical issues such as tubing blockages.
The particle size distribution is therefore a critical metric governing the performance of a powder coating and this can be measured simply and rapidly by laser diffraction, using a dry dispersion method. In this application note, we will present and discuss the results for a number of powder coatings measured using the Mastersizer 3000 and Aero S dry dispersion accessory.
Methods were developed to measure powder coatings following the principles of dry powder dispersion [1]. There are three stages to the dry method development: establishing a suitable flow; an air pressure titration; and selecting an appropriate air pressure by comparison with a reference result. The reference result may be a liquid dispersion laser diffraction measurement or may be from another technique such as microscopy, sieving or sedimentation. In this case, the air pressure selected was 2 bar, as this gave the best agreement with the liquid dispersion result.
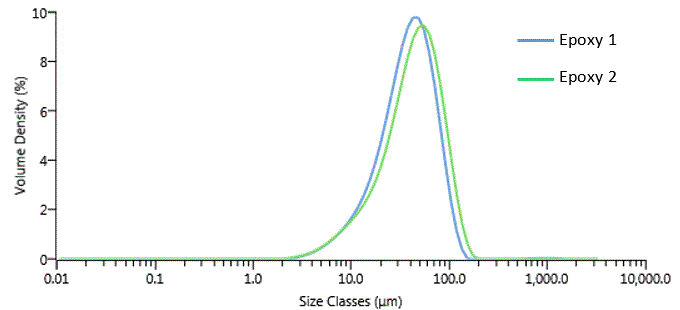
The particle size distributions of four powder coatings are shown in figures 1-2. There are two epoxy powders (figure 1) and two mixed polymer powders (figure 2). The samples have similar distribution profiles, but epoxy 2 is larger than epoxy 1: epoxy 2 has a Dv50 of 44 μm whereas epoxy 1 has a Dv50 of 39 μm (table 1). The larger particle size in epoxy 2 is more appropriate for building up thicker and multiple layers than epoxy 1, although this may result in a longer cure.

Figure 1: Particle size distributions for epoxy powder coatings.
Sample Name | Dv (10) (μm) | Dv (50) (μm) | Dv (90) (μm) |
Epoxy 1 | 13.9 | 38.8 | 78.2 |
Epoxy 2 | 14.3 | 44.4 | 91.5 |
Table 1: Percentiles compared for two different epoxy powder coatings.
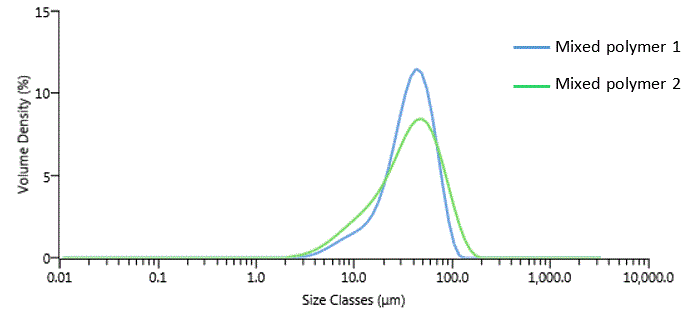
The particle size distributions of the two polymer coatings are shown in figure 2. The distributions are much broader than for the epoxies. The Dv50 values are both approximately 38 µm (table 2) but polymer 2 extends to both smaller and larger particle sizes. The increased polydispersity of Polymer 2 may improve the particle packing on the coating surface, reducing air inclusions and improving the mechanical properties of the finished product.

Figure 2: Particle size distributions for mixed polymer powder coatings.
Sample Name | Dv (10) (μm) | Dv (50) (μm) | Dv (90) (μm) |
Polymer 1 | 14.4 | 38.1 | 69.2 |
Polymer 2 | 10.7 | 37.8 | 84.4 |
Table 2: Percentiles compared for two different polymer powder coatings.
Once the method has been established, the reproducibility of the measurement needs to be assessed by looking at the variation between results. The ISO standard [2] states that the variation between repeated measurements (RSD%) should be less than 3% for Dv50 and less than 5% for Dv10 and Dv90. The ISO standard goes on to state that under ideal conditions and for samples above 1 μm in size, RSDs of less than 1% should be achievable. For these powder coatings, the RSDs are all well-within the ISO guidelines: the RSD of epoxy 2 was 0.4% for Dv50 (table 3).
Sample Name | Dx (10) (μm) | Dx (50) (μm) | Dx (90) (μm) |
Epoxy 2-1 | 14.2 | 44.3 | 91.3 |
Epoxy 2-2 | 14.2 | 43.9 | 91.0 |
Epoxy 2-3 | 14.3 | 44.4 | 91.5 |
Epoxy 2-4 | 14.2 | 44.4 | 91.8 |
Epoxy 2-5 | 14.2 | 44.4 | 91.2 |
Mean | 14.2 | 44.3 | 91.4 |
1xStd Dev | 0.0313 | 0.178 | 0.288 |
1RSD (%) | 0.220 | 0.403 | 0.315 |
Table 3: Typical reproducibility data taken from the epoxy 2 sample.
We have demonstrated that the particle size distributions of powder coating materials can be measured using the Mastersizer 3000 and Aero S dispersion accessory. Four different powder coatings were measured and all showed different particle size distributions, which may produce different coating finishes. The reproducibility of the measurements is within the ISO guidelines for laser diffraction.
[1] Technical note - Dry powder method development for laser diffraction particle size distribution measurements
[2] ISO 13320:2009 “Particle Size Analysis – Laser Diffraction Methods”.