Bovine serum albumin (BSA) is a cheap and readily available protein which separates well under most chromatographic conditions. It is therefore an excellent choice for a standard. However, it has a high propensity to form oligomers and these are normally resolved by the chromatography. The instructions below describe how to calibrate a Viscotek SEC system with a sample such as BSA.
Carefully creating a method takes just a few minutes and following this protocol will ensure that calculated results are as accurate and reliable as possible. Once the method is created, it takes just seconds to analyze the subsequent samples.
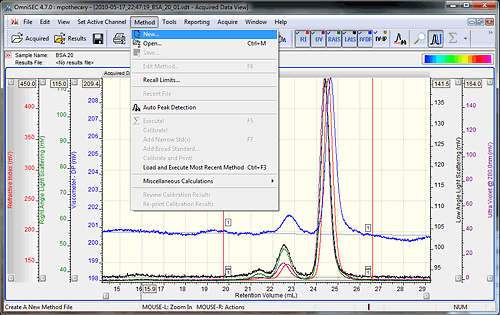
Open the data file to be used as the standard in OmniSEC. The concentration of the standard sample should have been known and input when the sample was run. The accuracy of this initial concentration is very important. Check that all detectors show good signal quality, and then add all of the detectors to the display by selecting the detector buttons (if using OmniSEC version 4.6, hold Ctrl while selecting the detectors). Set the baseline and integration limits around the entire protein sample using the right-click menu, and then select the 'Method - New' option from the main menu (figure 1).
|
Setting baselines and limits can be done by right-clicking on the 'Acquired Data View' and selecting the appropriate options. A quicker way to set limits and baselines is with the shortcut keys. Holding down the 'shift' key and left clicking in the Acquired Data View' will drop a limit at that elution volume on all of the detector chromatograms. A second left-click at a different location will drop the second limit. Holding down the 'shift' key and right clicking will place baselines on all of the detector chromatograms. If the 'control' key is held down, instead of 'shift', then the limits or baselines will only be placed on the active channel. To remove limits and baselines, select the appropriate option from the right-click menu.
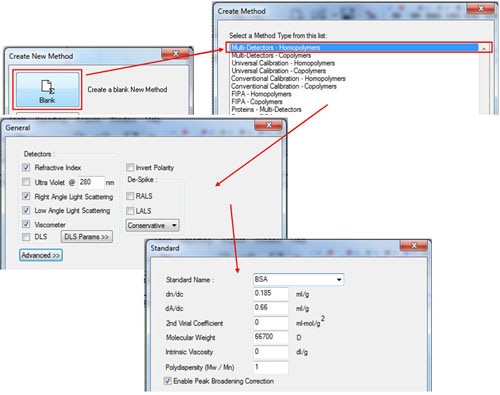
In the 'Create New Method' window, select the 'Blank' option, and then select in the 'Multi-Detectors-Homopolymers' option. The next screen will show the detectors to be calibrated. Select the concentration detector, either refractive index (RI) or ultraviolet (UV), and then click 'Next'. Enter the known parameters for the protein standard in the 'Standard' window. Those for BSA are shown in figure 2. Note, that the 2nd virial coefficient and intrinsic viscosity values are not required. However, if the values are known, they can be entered here. If the UV detector is used, the dA/dc value is equivalent to the extinction coefficient presented as A280 = X ml mg-1 cm-1 (The value at 1% can be used as long as this is consistent with the sample tab). The molecular weight value that should be entered here is that of the monomeric species (figure 2).
|
Protein dn/dc is typically constant at 0.185 ml/g.
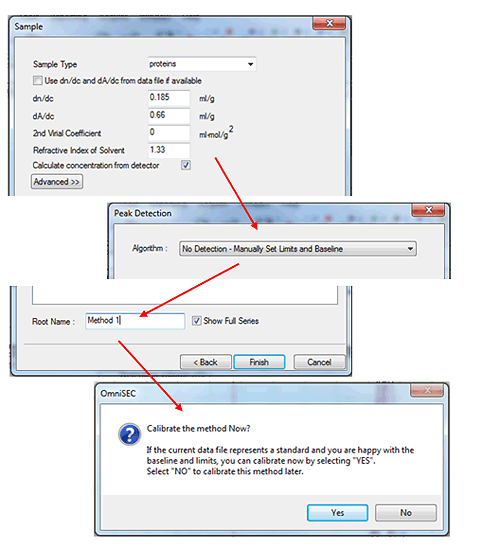
After entering the standard properties, click 'Next', and then fill in the appropriate values in the 'Sample' window (figure 3). In the sample window, the box labeled 'Calculate concentration from detector' must be checked. To complete the initial calibration keep the 'peak detection' algorithm set to Manual and then save the calibration with an appropriate name. After saving, the software will ask 'Calibrate the method now?' Click 'Yes' and the calibration results will be displayed.
(If limits have not already been set, a different message will appear - click 'OK', set limits and baselines as described earlier and then select 'Calibrate!' from the 'Method' menu.)
|
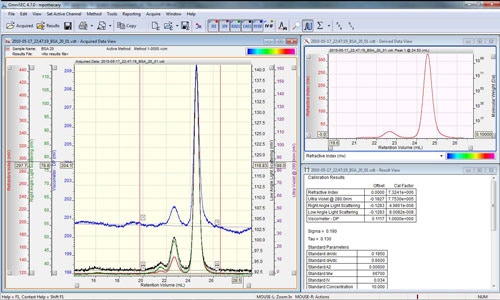
The peaks are aligned and the detector calibration constants reported in the 'Result View' (figure 4).
|
For a single component standard, such as low polydispersity polystyrene, this would complete the detector calibration. However for a multi-component standard, such as BSA, a second stage is required to correct for the fact that the sample has formed some oligomers.
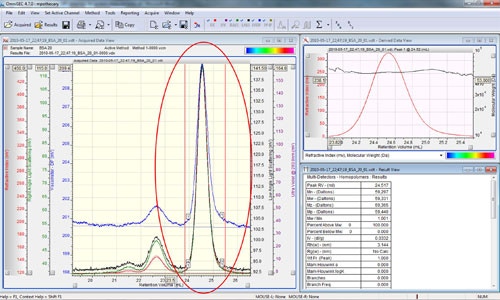
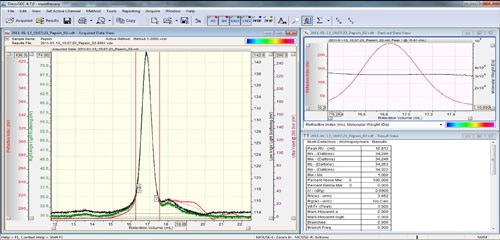
For the next stage, right click the chromatogram and select the 'Clear LIMITS on ALL Channels' or the 'Delete All Limits' option. Zoom in on the monomer peak and set the integration limits around only the monomer peak using the 'Add limits on all Channels' option in the right click menu (figure 5).
|
Note that the calculated values in the results window represent the sample within the selected limits. As evident in figure 5, the molecular weight results for this 66 kDa monomer are incorrect. This is a consequence of using the monomer molecular weight to represent the weight average molecular weight for the entire sample in the original calibration.
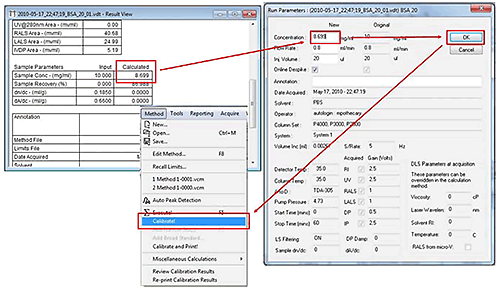
Scroll down in the 'Results View' to the calculated Sample Concentration, press F3 to open the 'Run Parameters' window (or use the File-Run Parameters), and then enter the calculated Sample Concentration in the New Concentration field. Press OK, then recalibrate by selecting the Method-Calibrate option from the Main Menu tool bar.
|
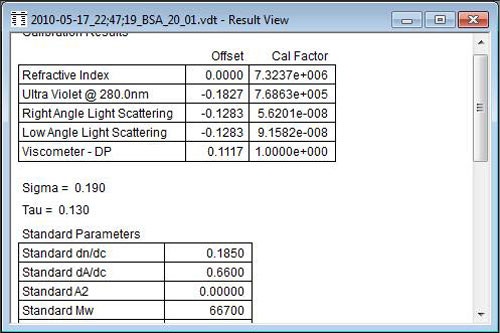
Once the recalibration is completed, it is always a good idea to review the calibration results. Figure 7 shows the calibration results for the example presented here. The Cal Factors shown are indicative of typical values for detector calibration constants, as are the Sigma and Tau values. Sigma, indicative of band broadening, should be around 0.2, and Tau, indicative of tailing, should be smaller than Sigma.
|
As a final check of the calibration results, it is instructive to treat the standard measurement results as an unknown, to see if the calibration yields the expected results. Also, the dimer molecular weight should be accurately calculated by the method.
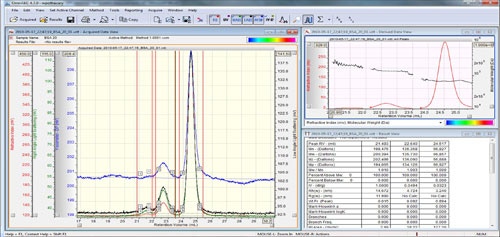
In the Acquired Data View, add limits around the dimer peak and if the result is not automatically re-calculated, click 'execute' or press F5. The results should now show two columns representing the two peaks. The monomer peak should have a molecular weight very close to that which was input in the standard options (in the case of BSA, 66 kDa) and the dimer peak should have a molecular weight of twice the monomer (133 kDa). Depending on the BSA sample and the resolution, a third peak may be visible representing the trimer and this peak should have a molecular weight of three times the monomer (201 kDa).
The molecular weight traces in the Derived Data View should be plateaus indicating that each peak is monodisperse (to view all peaks together, right click in the 'Derived Data View' and select 'All Peaks Mode' or 'Peak by Peak Mode'). This is the equivalent of the Mw/Mn value in the results table. This value should be close to 1 and is typically less than 1.05. For a mixture of protein oligomers, this is the type of result that one would expect, with each peak showing a constant molecular weight.
|
The calibration is now complete and the method can be used to analyze other protein samples. It is best practice to run a standard and calibrate at the beginning of each set of measurements. If calibration every time is not required, then at the very least, a standard should be run and analyzed with the existing method to ensure it is working properly.
To analyze the next sample in the sequence, press F12 to move to the next file or open the sample of choice using the 'File - Open' menu. The file to be analyzed must be in the same folder as the standard. Set limits and baselines around the peak and click 'Execute' or press F5. The sample will be immediately analyzed using the method created.
|
It is important to understand "what" is being calibrated during this process. The calibration procedures within the Viscotek OmniSEC software perform two functions.
There are a variety of GPC detector calibration standards available, either from Viscotek or 3rd party vendors. When selecting an appropriate calibration standard, there are three things to consider.
When it comes to protein measurements, the requirements for calibration of the GPC detectors are no different. The caveat is that there is currently no protein standard that satisfies the low polydispersity requirement, as proteins tend to form oligomeric structures in solution. While one could select a low molecular weight synthetic polymer standard, identifying one that is compatible with the chromatography and has Mw/Mn of close to 1 is difficult. An alternative approach is to use a two step calibration technique which facilitates calibration of the GPC detectors using a readily available standard protein that can be resolved into its separate oligomer populations.
Using this technique, the concentration detectors are calibrated first by treating the entire sample as a single entity. In the second step the concentration of the monomer peak is calculated and then the monomer alone is used to calibrate the light scattering detectors.