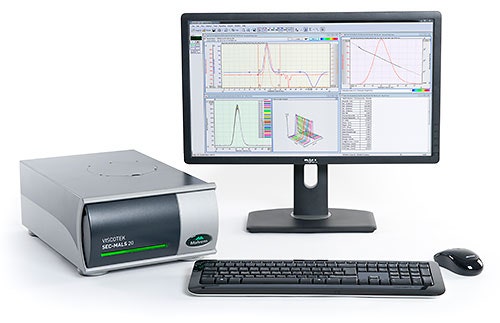
The Viscotek SEC-MALS 20 is a 20 angle MALS system for the measurement of absolute molecular weight of natural and synthetic polymers and proteins. The aim of this technical note is to show through a series of application examples, how the performance specifications are derived.
|
The molecular weight range specification for the Viscotek SEC-MALS 20 is from <1000 g/mol to >107 g/mol. These were arrived at by measuring high and low molecular weight polystyrene samples. These were separated in THF using two Viscotek T6000M columns at a flow rate 1 ml/min.
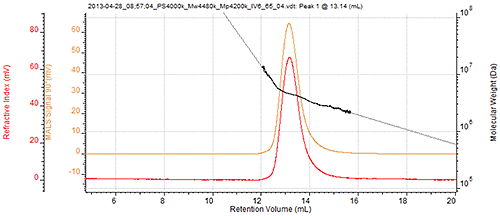
The first is a 4.5x10⁶ g/mol sample that is the largest in the Viscotek universal calibration standard kit. A chromatogram overlaid with the molecular weight distribution is shown in figure 2. As with most polymer samples, the molecular weight of the sample covers a distribution of masses. The largest measured mass in this sample is over 107 g/mol. This specification is governed more by the sample and the separation than the instrument which could likely measure a higher molecular weight. However, this is the largest molecular weight that has so far been measured using the Viscotek SEC-MALS 20.
|
The <1000 g/mol specification for the lowest measurable molecular weight was measured using the 1055 g/mol polystyrene standard in the Viscotek universal calibration kit using the same conditions as described above. A chromatogram and overlaid molecular weight distribution are shown in figure 3, below. It can be seen that the molecular weight has been measured across the peak and extends below 1,000 g/mol. The weight-average Mw is calculated to be 1,117 g/mol.

|
The molecular weight accuracy is quoted as being within 2% for a NIST standard reference material, SRM 1478. This sample is certificated by NIST to be 37,400 g/mol. The molecular weight of this sample was measured to be 37300 g/mol by the SEC-MALS 20. While this is within 0.5% of the certificated value; a figure of 2% is quoted to allow for variation between systems and experiments. Figure 4 (below) shows the chromatogram and results.

|
The specified range for the measurement of radius of gyration (Rg) for the Viscotek SEC-MALS 20 is from 10 nm to 150 nm. These were achieved by measuring high and low molecular weight polystyrene samples. These were separated in THF using two Viscotek T6000M columns at a flow rate 1 ml/min.

|

|
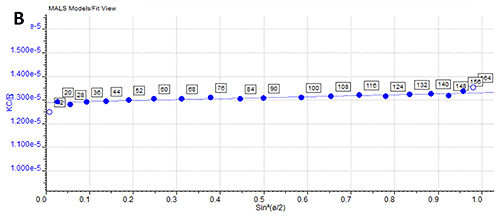
The first is the same 4.5x10⁶ g/mol sample as used in figure 2. As with molecular weight, the Rg has a distribution across the sample. The largest measured size in the sample is 150 nm. This specification is again governed more by the sample and separation than the instrument which could likely measure a larger size if the sample could be separated. However, this is the largest size that has so far been measured using the Viscotek SEC-MALS 20. Figure 5A shows the chromatogram overlaid with the measured Rg. Figure 5B shows the angular fit data which at this size demonstrating the strong angular dependence of the scattered light which has been well characterized by the 20 angles of the system.
The second sample is a 235,000 g/mol polystyrene sample with a high polydispersity measured under the same conditions as the previous sample. This sample is commonly used as a verification standard for the Viscotek systems. Figure 6 shows the chromatogram with the overlaid with the measured Rg. The ascending edge of the peak has a largest Rg of approximately 40 nm which decreases across the peak until a retention volume of 18.4 ml when the measured Rg is 10.2 nm. It can be seen in the angular plot that the scattering at this point is virtually isotropic and measuring sizes lower than this will not be possible.

|
|
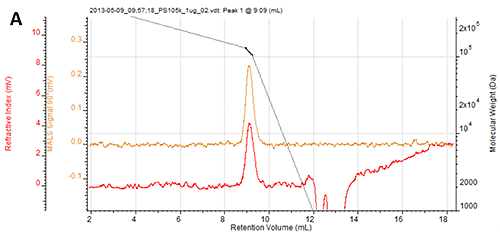
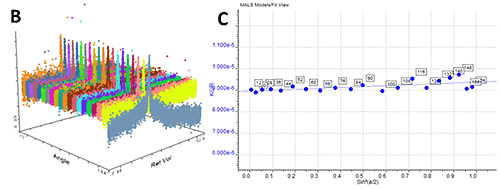
The limit of detection specification is defined as the smallest mass that can be injected into the SEC system and have its molecular weight successfully measured using the SEC-MALS 20. This was tested first using a 105,000 g/mol polystyrene regularly used as a calibration standard for the systems. The sample was separated using a single T6000M column in THF at a flow rate of 1 ml/min. A total mass of 1.14 µg of the polystyrene standard was injected using a concentration of 0.114 mg/ml and an injection volume of 10 µl. The chromatogram can be seen below. Not only has the sample been detected by the system, but the molecular weight has been correctly measured to be 105 kDa. Studying the angular data, it is also clear that the sample has been measured by every one of the 20 angles in the system including the 12° detector. All the angles have been included in the analysis.
|
|
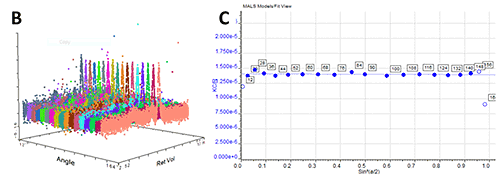
A similar experiment has been performed using the standard protein, bovine serum albumin (BSA). The sample was separated using a protein light scattering column. A total mass of 2µg of BSA was injected using a concentration of 0.2 mg/ml and an injection volume of 10 µl. The chromatogram can be seen below. Not only has the sample been detected by the system, but the molecular weight has been measured to be 68 kDa. Studying the angular data, it is again clear that the sample has been measured by 17 of the 20 angles in the system. With a slightly reduced signal-to-noise in an aqueous measurement, the 12°, 156°, and 164° have been removed from the analysis to maximize its accuracy.

|
|
It is therefore clear that the Viscotek SEC-MALS 20 has the sensitivity for almost any application.
This Viscotek SEC-MALS 20 is the newest and most advanced MALS detector available. With more angles and better functioning lower angles than any other MALS system on the market, it has the widest application and measurement range. The experiments described in the technical note have successfully demonstrated the high and low molecular weight and Rg range as well as the accuracy of the molecular weight measurements and the sensitivity of the system to small injection masses.