In this application note, well known protein samples were used in a cross-contamination study to demonstrate the lack of detectable cross-contamination in the Zetasizer APS.
The protein samples used were insulin, measured in both a "monomeric form" (the insulin hexamer) and in an "oligomeric form". In addition to the insulin samples, the 42 amino acid long amyloid beta peptide (Abeta) was measured. Abeta is well-known to be sticky and adheres to plastic, and is therefore a good test for the cleanliness of the sampling system. This is discussed further in application note MRK1957 (Accurate and repeatable measurement of proteins using the Zetasizer APS). The Abeta sample was present in two forms, fibrillar and oligomeric.
The order in which the samples were loaded was chosen to maximize the risk of cross-contamination. The oligomeric insulin was loaded first using a standard pipette, followed by the small and pure insulin, followed by the larger polydisperse Abeta samples. A large protein aggregate scatters much more light than a small pure protein sample, as the amount of light scattered is directly proportional to the diameter to the power 6. Therefore, if cross-contamination of sample did occur, the polydisperse Abeta sample would be detected in a small homogenous protein sample.
The samples were measured in a 96-well Corning Costar plate, but any other plate with standard inter-well distance and plate height could have been used. The sample from each well was aspirated to the measurement flow cell. The sample was equilibrated for 20 seconds before the measurement was started to ensure thermal equilibration had occurred. Each sample was measured in triplicate and the measurement duration automatically selected by the software to ensure optimal data quality.
After measurement, the samples were sent to waste, and the flow system cleaned using a custom wash: 1 syringe volume of deionised water (1250ul), then 3 syringe volumes of 1M NaOH and finally 4 syringe volumes of deionised water to ensure that there was no NaOH left in the system.
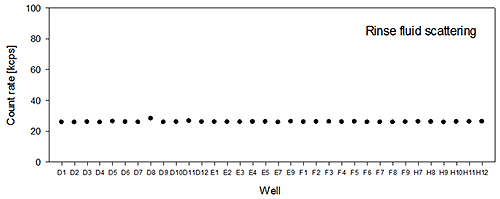
The "rinse fluid scattering" is the scattering measured from the rinse fluid before the measurement of the sample in the well. For this investigation, the rinse fluid used was de-ionised water. By measuring the rinse fluid scattering, the user can determine whether there is any remaining sample in the measurement flow cell, which would increase the background scattering.
The samples were kept in the fridge or freezer until the measurements were made. To prepare the samples, all but the fibrillar Abeta sample were centrifuged at 14,000g for 10 minutes before the supernatant was removed and loaded onto the plate.
The measurements were performed twice, prepared in the same way both times. The measurements used the same Zetasizer APS instrument.
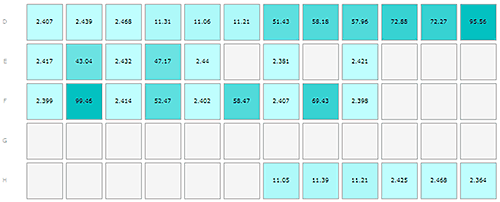
The first run was loaded as shown in the Plate Navigator view in figure 1A.
The rinse fluid scattering value measured before introduction of the different samples is shown in figure 1B. It can be seen that the value is stable over all the wells sampled. The average value and standard deviation of the rinse fluid scattering was 26.0+/-0.4kcps, which strongly suggests that there is no sample remaining in the measurement flow cell and hence no indication of cross-contamination occurring.
|
Monomeric insulin: wells D1-3, E1, E3, E5, E7, E9, F1, F3, F5, F7, F9, H10-12.
Oligomeric insulin: wells D4-6, H7-9.
Oligomeric Abeta1-42 peptide: wells D7-9, E2, E4.
Fibrillar Abeta1-42 peptide: wells D10-12, F2, F4, F6, F8
|
The mean hydrodynamic radius of the monomeric insulin sample was measured to be 2.71+/-0.6nm, which corresponds to a protein with an approximate molecular weight of 34.7+/-1.8 kDa. This is in good correlation to the known molecular weight of hexameric insulin which is 34.8kDa.
As there is no change detected in size, despite the samples being ordered to increase the risk of cross-contamination, this strongly indicates the lack of cross-contamination.
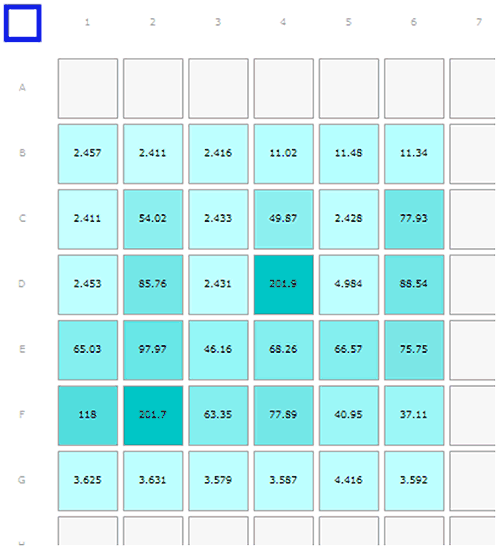
The second run of the samples was loaded as shown in the Plate Navigator view in figure 2A. This time, the insulin sample in well D5 was deliberately contaminated before the measurements were started. The pipette tip was inserted into the fibrillar Abeta sample in D6; quickly withdrawn, then used to pipette the sample into well D5.
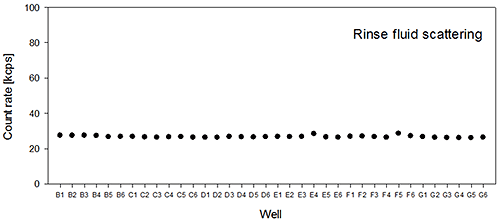
The rinse fluid scattering average and standard deviation was 26.7+/-0.6 kcps for the sampled wells on the second plate (Figure 2B). This result corresponds very well to the mean value obtained for the first plate, and strongly indicates that there is no sample left in the measurement flow cell and that the cleaning procedure chosen is sufficient to remove possible aggregates of these proteins.
|
Monomeric insulin: wells B1-3, C1, C3, C5, D1, D3, D5*. Oligomeric insulin: wells B4-6. Oligomeric Abeta1-42 peptide: wells C2, C4, C6, E1, E3, E5, F4-F6. Fibrillar Abeta1-42 peptide: wells D2, D4, D6, E2, E4, E6, F1-F3. Human serum albumin: wells G1-G6
|
The mean hydrodynamic radius of the monomeric insulin samples on the second plate (excluding the sample in D5 which was known to be contaminated) was determined to be 2.73+/-0.05 nm. This corresponds to an estimated molecular weight of 35.3+/-1.5kDa for a globular protein, which is within the error of the value obtained for the insulin on the first plate.
A more detailed look at the hydrodynamic size repeatability of these measurements was studied in another application note: [MRK1957].
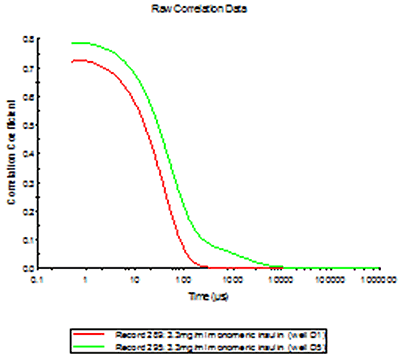
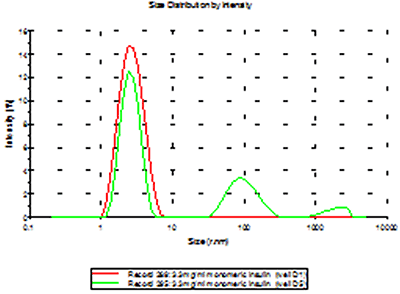
To demonstrate the difference between a contaminated sample (well D5) and the other samples, an overlay of the distributions of one of the pure insulin samples (D3) and the insulin sample contaminated with Abeta are shown in figure 3. The D5 measurement illustrates what is expected in the case of cross contamination; an increase of sample intensity (due to the larger scattering from the aggregates) and possibly the appearance of secondary populations.
|
|
These measurements show how stable the rinse fluid count rate is for two different plates containing well-known protein samples, of which some are known to be sticky. The rinse fluid count rate is very stable, only varying around 2%, and it is therefore concluded that there is no detectable cross-contamination in the measurement flow cell.
The expected effect of cross-contamination between samples was demonstrated in well D5 in plate 2, where the pipette tip had been inserted into well D6 (fibrillar Abeta) before the sample was loaded into well D5. This effect was not seen in any of the other wells sampled.
All the other wells containing the hexameric insulin show remarkable stability in the hydrodynamic size determined. The measurements show excellent reproducibility both within a plate and between two different plates, with the first plate giving a mean hydrodynamic radius of 2.71+/-0.06nm and the second plate 2.73+/-0.05nm for insulin.
To conclude, the stable rinse fluid scattering and excellent reproducibility of the small protein sample size on both plates are two strong indications that there is no detectable cross-contamination in the Zetasizer APS system when adequate cleaning procedures are used.