Static light scattering can be used to measure the molecular weight of macromolecules such as proteins and polysaccharides, as well as their virial coefficients to determine intermolecular interactions. This application note details molecular weight measurements performed on various proteins, polymers and polysaccharides on the Zetasizer Nano. Data from Polystyrene [10kDa, 100kDa, 980kDa] in toluene and dextrane [63kDa] in water are shown as representative examples.
The Zetasizer Nano System combines dynamic, static and electrophoretic light scattering technologies enabling for the measurement of particle size, zeta potential and molecular weight.
Static light scattering (SLS) is a non-invasive technique used for characterizing macromolecules in solution. A beam of monochromatic light is directed through a sample and the intensity of the light scattered at an angle of 173° by the molecules is measured. SLS makes use of the time-averaged intensity of scattered light, from which the weight-averaged molecular weight and second virial coefficient can be determined.
The intensity of scattered light that a macromolecule produces is proportional to the product of the weight-average molecular weight and the concentration of the macromolecule. For molecules that show no angular dependence in their scattering, the relationship between the intensity of scattered light and their molecular weight is given by the Rayleigh equation:

|
where K is an optical constant, Rθ is the Rayleigh ratio of the scattered to incident light intensity, M is the weight-average molecular weight, A2 is the second virial coefficient and C is the sample concentration.
Therefore, a plot of KC/Rθ versus C is expected to be linear with an intercept equivalent to 1/M and a slope equal to the second virial coefficient A2. Such a plot is known as a Debye plot.
The second virial coefficient is a property describing the interaction strength between the molecule and the solvent. For samples where A2 > 0, the molecules tend to stay in solution. When A2 = 0, the molecule-solvent interaction strength is equivalent to the molecule-molecule interaction strength and the solvent is described as being a theta solvent. When A2<0, the molecules will tend to crystallize or aggregate.
Further details of the theory of molecular weight determinations from static light scattering measurements can be found in other application notes available from the Malvern Instruments website.
This application note details molecular weight measurements performed on various proteins, polymers and polysaccharides on the Zetasizer Nano.
It should be noted that the Zetasizer Nano software measures the intensities of the scattered light of the prepared samples and automatically calculates the molecular weight and second virial coefficient from the data using a Debye plot.

|
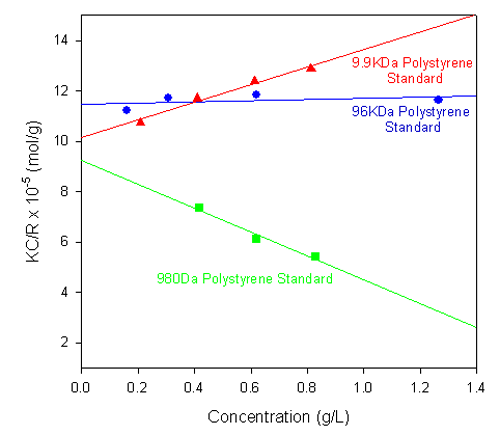
Figure 1 shows the single-angle Debye plots for a series of polystyrene polymer standards prepared in toluene and measured on a Zetasizer Nano S. The measured molecular weights and second virial coefficients (A2), along with known molecular weight values, are given in table 1. In each case, the dñ/dC value was taken to be 0.110 mL/g.
As shown in the table of results, the calculated molecular weights are consistent with the known values.
| Polymer | Measured Molecular Weight (kDa) | Reported Molecular Weight (kDa) | 2nd Virial Coeffient (A2) |
|---|---|---|---|
| Sample A | 1.08 | 0.980 | -2.37 x 10⁻² |
| Sample B | 9.865 | 9.86 | 17.51 x 10⁻⁴ |
| Sample C | 102 | 96 | 8.25 x 10⁻⁴ |
The gradients of each plot (the second virial coefficients) vary from positive (9.9 kDa polystyrene) to negative (980 Da polystyrene standard). The positive second virial coefficient indicates that the interaction energy between each polymer and the solvent is stronger than the interaction energy between the polymer and itself, whereas the negative second virial coefficient indicates that the polymer molecules do not like toluene as a solvent.
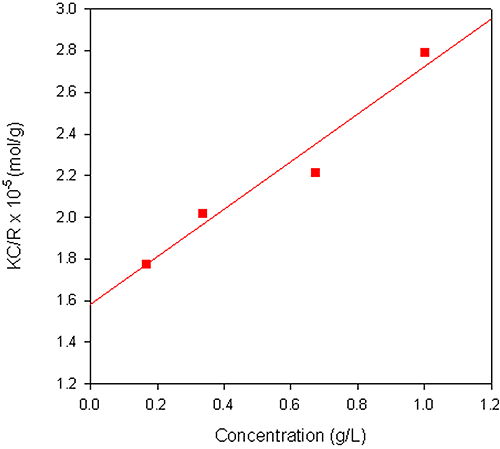
The Debye plot obtained from a sample of dextran in water is shown in figure 2. The sample had a reported molecular weight of 68 kDa and the weight-average molecular weight obtained from the measurement was 63.3 kDa. A dñ/dC value of 0.140 mL/g was used for the measurements.

|
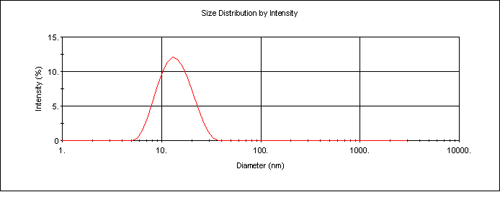
The Zetasizer software enables collection of particle size distribution data using dynamic light scattering as well as the absolute measurement of intensity for molecular weight analysis. This enables the determination of the modality of the sample prior to molecular weight measurement. This is important in determining the cleanliness of the samples prior to analysis. Figure 3 is the intensity size distribution obtained from the stock concentration of the dextran solution (10 mg/mL). The sample had a z-average diameter (the mean diameter based upon the intensity of scattered light) of 13.5 nm. The monomodal distribution obtained confirms that there were no aggregates present. The molecular weight obtained from light scattering is weight-averaged and therefore the presence of any aggregates will contribute to this value.

|
The z-average diameter of 13.5 nm can be used to calculate an estimated molecular weight of 64.8 kDa using an empirical calibration graph developed by Malvern Instruments. This molecular weight estimation is available in the Nano software and is useful for verifying the experimental data obtained.
The Zetasizer Nano is the only commercial instrument capable of measuring the size, zeta potential and molecular weight in a single, compact unit. The incorporation of NIBS optics gives the sensitivity required for the measurement of very small, weakly scattering samples and the determination of the molecular weight. In addition, the use of backscatter detection enables the measurement of concentrated, opaque samples without the need for dilution.