The performance and ease of manufacture of LED devices is affected by the size and shape of phosphor particles. Therefore the characterisation of particle size and shape parameters is desirable to aid product development and control device properties in a production environment.
The Sysmex FPIA-3000 is a dynamic flow particle imaging system, which rapidly characterises the size and shape of particles in a suspension. The breadth of information produced by the Sysmex FPIA-3000 is useful in product development and its ease of use and speed make it a valuable quality control tool.
Here we demonstrate the characterisation of phosphor particles with the Sysmex FPIA-3000 and discuss the importance of the measured parameters to the various properties that can be controlled or optimised in the development and production of LED devices.
There is world-wide drive to reduce energy consumption both in industry and in the home. Lighting accounts for 20% of global energy use; LED lighting can reduce this by delivering a 65% increase in efficiency and, as Table 1 shows, LED lighting is the least expensive option over a devices lifetime [1, 2]. However, due to the high initial cost per bulb LED lighting is seen as an expensive option.
| LED | CFL | Incandescent | |
|---|---|---|---|
| Lightbulb projected lifespan | 50,000 hours | 10,000 hours | 1,200 hours |
| Watts per bulb | 10 | 14 | 60 |
| Cost per bulb | $35.95 | $3.95 | $1.25 |
| KWh of electricity used over 50,000 hours | 300 - 500 | 700 | 3000 |
| Cost of electricity (@ $0.10 per KWh) | $50 | $70 | $300 |
| Bulbs needed for 50,000 hours of use | 1 | 5 | 42 |
| Equivalent 50,000 hours bulb expense | $35.95 | $19.75 | $52.50 |
| Total cost for 50,000 hours | $85.75 | $89.75 | $352.50 |
The majority of the population are comfortable with the light produced by incandescent bulbs, and while LED lighting can offer similar results, the image of the LED light has suffered due to comparisons with compact fluorescent systems (CFL) commonly known in the UK as energy-saving bulbs. CFL lighting can produce a cold light compared to incandescent lights and LED lighting is often assumed to be the same due to the energy-saving label. A large effort has gone into producing a broad spectrum of light from an LED in order to improve public perception.
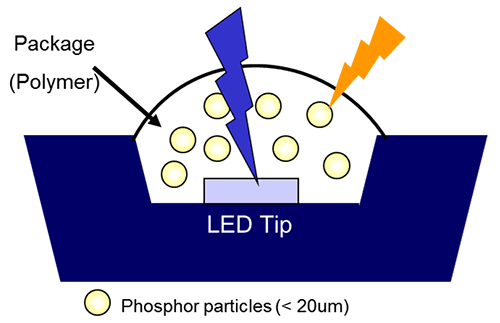
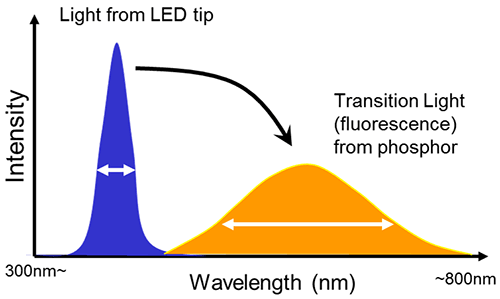
Figure 1 shows the structure of an LED bulb. The LED is covered in a polymer matrix containing phosphor particles, these particles transform the narrow band LED light into a broadband light that is more pleasing to the eye. The particle size plays an important role in creating and optimising this broadband spectrum.
|
|
Smaller particles create higher angle scattering leading to a broader spectrum but a bulb with only small particles would have a low intensity and a short lifetime. A balance is required to maximise the lifetime and optimise the spectrum of light produced.
The shape of the phosphor particles can affect the manufacturing process since smooth round particles will flow very easily and non-circular or rough particles will have more friction. This will change the distribution of the particles in the polymer matrix and the ease of applying the polymer. Therefore the shape must also be optimised to optimise the coating itself.
Automated imaging techniques give information on both particle size and shape. The Sysmex FPIA-3000 makes size and shape analysis of particles in suspension a straightforward and routine task. The speed of operation means this technique is suitable for use as a quality assurance instrument.
The Sysmex FPIA-3000 is a fully automated dynamic flow particle imaging instrument for the measurement of the shape and size of particles in suspension. It uses sheath flow and high speed image analysis, typically generating data within 2.5 minutes. Using multiple objectives the Sysmex FPIA-3000 can cover the size range 0.8 µm to 300 µm.
Phosphor samples were prepared for analysis by taking an aliquot of phosphor powder and suspending in de-ionised water with 0.01% surfactant; this suspension was dispersed by the Sysmex FPIA-3000 with the aid of sonication. For these investigations the 20x objective was used in high power field mode giving a 0.8 µm to 20µm size range.
|
|
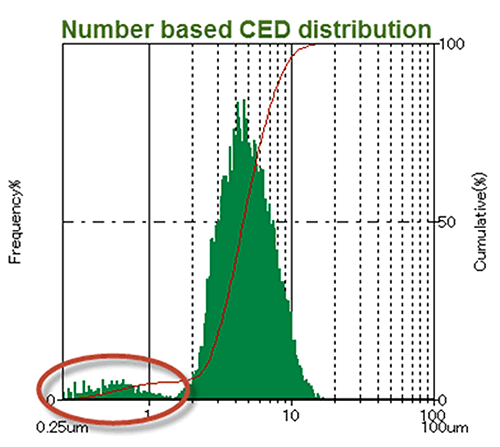
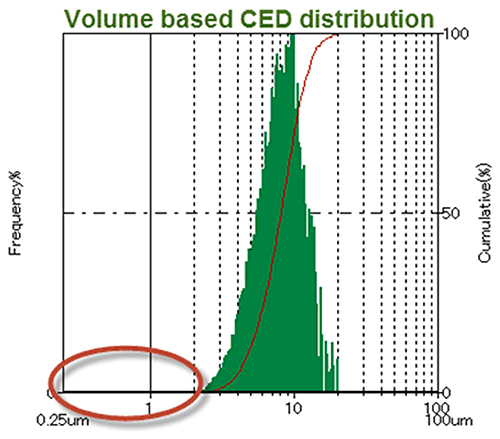
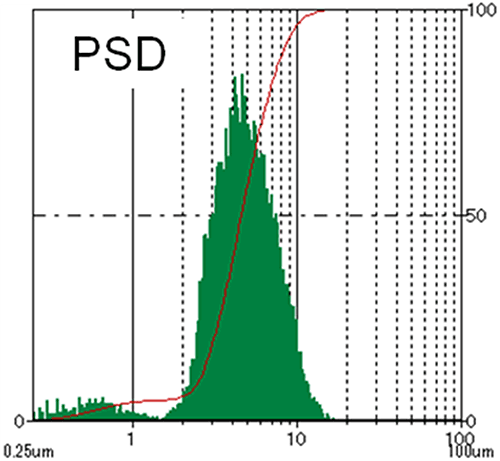
Particle size distributions are often reported in terms of the Circular Equivalent Diameter (CED); the diameter of a circle with the same area as that of the particle analyzed. Figure 2 shows the number and volume based CED particle size distributions for the phosphor powder sample. Since image analysis is a number based counting technique, where every particle has an equal weighting in the distribution, a number based distribution is a natural way to view results. A cubic transformation enables the particle size distributions to be viewed by volume.
The number based CED distribution reveals the presence of a small percentage, less than 6%, of particles smaller than 2 µm. When converted to volume this small fraction is not evident, therefore an imaging technique may be more appropriate than an ensemble based sizing technique when identification of fines is important. Understanding the number based size distribution of the phosphor particles is important to fully understanding the lifetime and light spectrum emitted from the LED. Therefore to fully characterize the particle size distribution, an imaging technique is preferable.
The ease of manufacturer of the phosphor coating is related to the particle shape. Adequate dispersion of the particles within the coating will be critical to providing an even and reproducible light across devices. The dispersion of particles is related to particle flow which is also related to particle shape.
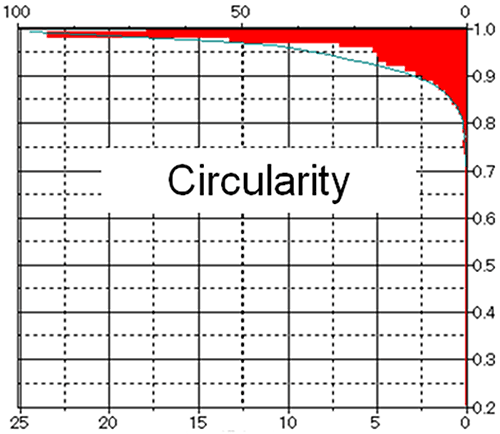
One parameter used to define particle shape is circularity which is defined in Equation 1. An image of a perfectly circular particle will have the same perimeter as the circle with the same area as the particle image. Therefore, a perfectly circular particle will have a circularity of one.

|
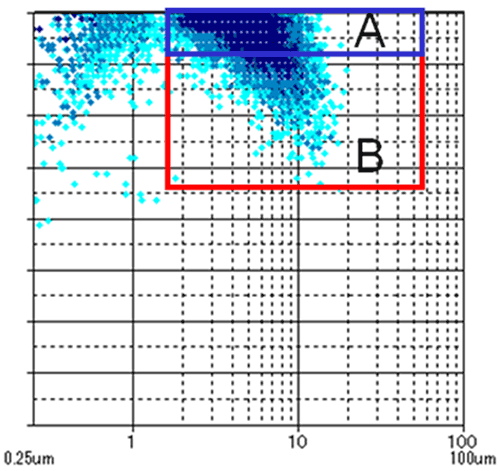
The Sysmex FPIA-3000 software can plot a scattergram showing the relationship between any two recorded parameters. Figure 3 shows a scattergram relating the CED distribution with the circularity distribution, revealing the relationship between particle size and particle shape. The blue points represent the population density of particles in that parameter region. The darker the blue the higher the particle population.
|
|
|
|
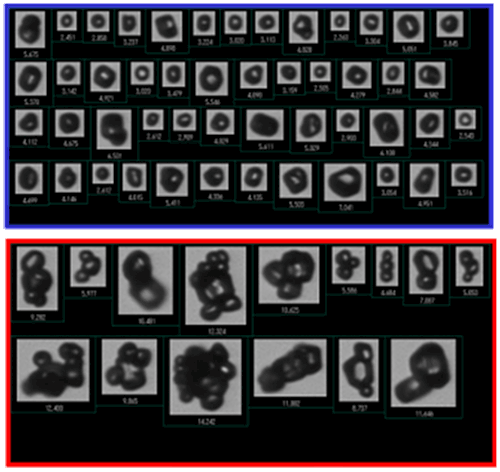
Figure 3 indicate areas of primary particles (Area A) and agglomerated particles larger than 2 µm (Area B), accompanying particle images are shown in the top-left of the figure. Area A shows that 36% of the particle population by number are high circularity primary particles. Area B in the scattergram reveals that 64% of the particle population are irregular non-circular particles, the particle images associated with this area reveal these are agglomerates.
The desirable form of the product is the primary particles and the percentage of primary particles in the sample could form the basis of a quality control test. Further research might link desirable features for manufacture to a 'fingerprint' in the scattergram.
Shape of phosphor particles is as critical as their size for the behaviour of phosphor coated LED lighting both at the manufacture stage and for the final device.
The Sysmex FPIA-3000 rapidly characterises both the size and shape of phosphor particles in suspension.
The information obtained using the Sysmex FPIA-3000 can be linked to device characteristics to aid product development. The particle size and shape characteristics may also be used to develop quality assurance criteria to aid product manufacture.