The functional and manufacturing properties of wheat flour are controlled by the proportion of A-type to B-type starch grains and protein. MDRS is used to chemically identify and morphologically characterize these particles in two brands of wheat flour. A gluten-free flour is also analyzed for comparison.
Wheat flour is expected to reach a global production level of 411 million metric tons by 2024 [1], translating to a value of $206 billion, based on an average global price of $0.5/kg [2]. Starch is the primary component of wheat flour and serves several functions, including gelatinization, swelling and pasting of the dough, which is related to the proportion of A- and B-type grains [3]. The composition of each grain type varies, leading to different rates of digestion and hence different glycemic indices [4]. These properties can be adjusted by controlling the relative ratio of A- and B-type starch grains [5].
In this study, the composition of the powder and particle morphology of three flour products was characterized by Morphologically-Directed Raman Spectroscopy (MDRS) using the Morphologi 4-ID. Using this technique, starch particles were differentiated by their chemical identity and subsequently characterized by particle size and shape.
The three flour products were premium brand and supermarket own brand wheat flours, and a gluten-free flour. 19 mm3 of each sample was automatically dispersed using the integrated Sample Dispersion Unit (SDU) at its high energy setting. Each sample was measured using 50× magnification with 2 z-stacks and the Sharp Edge segmentation method. For each sample, 2000 particles with a circular equivalent (CE) diameter lower than 20 µm were targeted for Raman chemical identification with a spectral acquisition time of 30 seconds at 100% laser power.
A reference library was created from spectra of six discrete components including starch, protein, a starch-protein composite, gamma-oryzanol, calcium carbonate and calcium sulfate (Figure 1). During the analysis, every particle spectrum was compared by correlation to the library spectra and particle classifications were set according to the correlation scores. Correlation is scored from 0 to 1, where 0 indicates no correlation and therefore the sample particle is a different chemical to the reference, and 1 indicates a perfect correlation and therefore the particle is the same chemical as the reference. Typically, a threshold value is set at a position where the user has confidence that chemical components can be accurately differentiated.
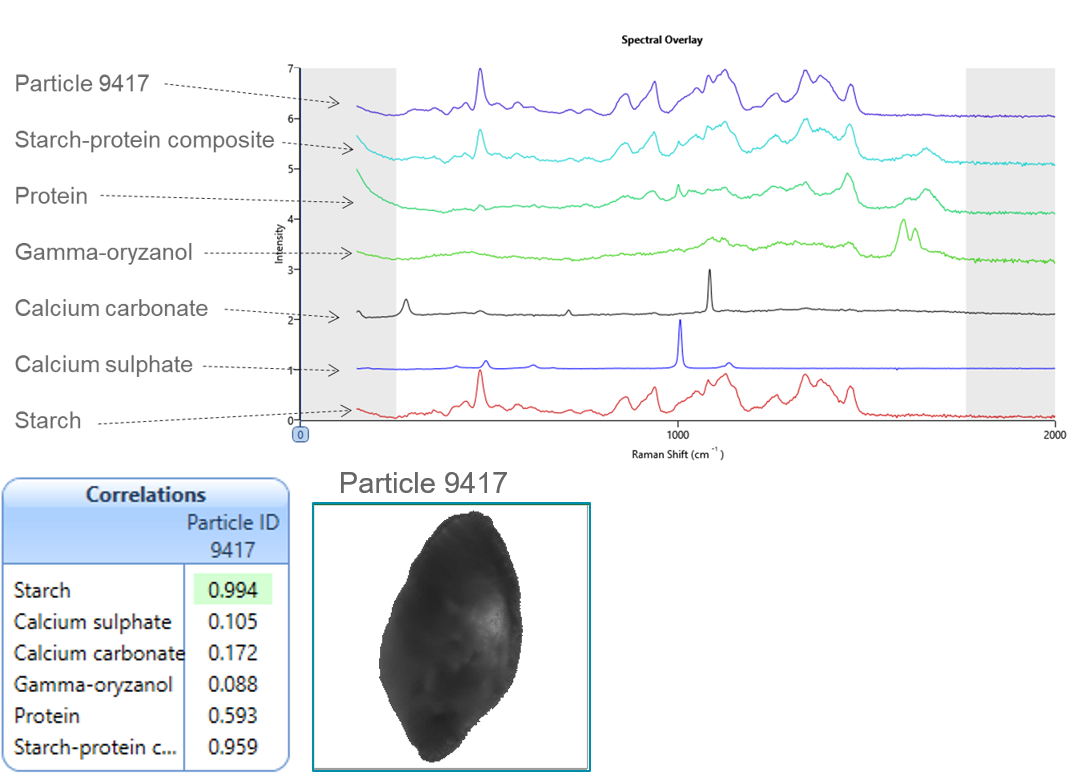
Figure 1: Raman library spectra of six flour known components, compared with a spectrum from a sample particle. The image of the particle is also shown. The correlation table shows the correlation scores of the particle spectrum, compared to the six library spectra.
Figure 2 shows the particle size distributions of the two standard wheat flours (premium brand and supermarket own brand) and the gluten-free flour, along with example particle images. The larger particles in all distributions appeared more satellited and irregular in shape compared to the smaller particles, which appeared more spherical. This is in keeping with reported shape differences between A- and B-type granules [5].
The particle size distribution of the gluten-free flour also appeared monomodal, whereas that of the premium and supermarket brand wheat flours had a broader and more bimodal distribution, which was indicative of discrete A- and B-type populations of starch particles. A- and B-type particles are defined by their size, where A>10 µm and B<10 µm [3]. However, starch is not the only component in wheat flours. Flour also contains protein and other trace components. MDRS was used to chemically identify the particles, using Raman spectroscopy, followed by characterization of the size and shape distributions of each component.
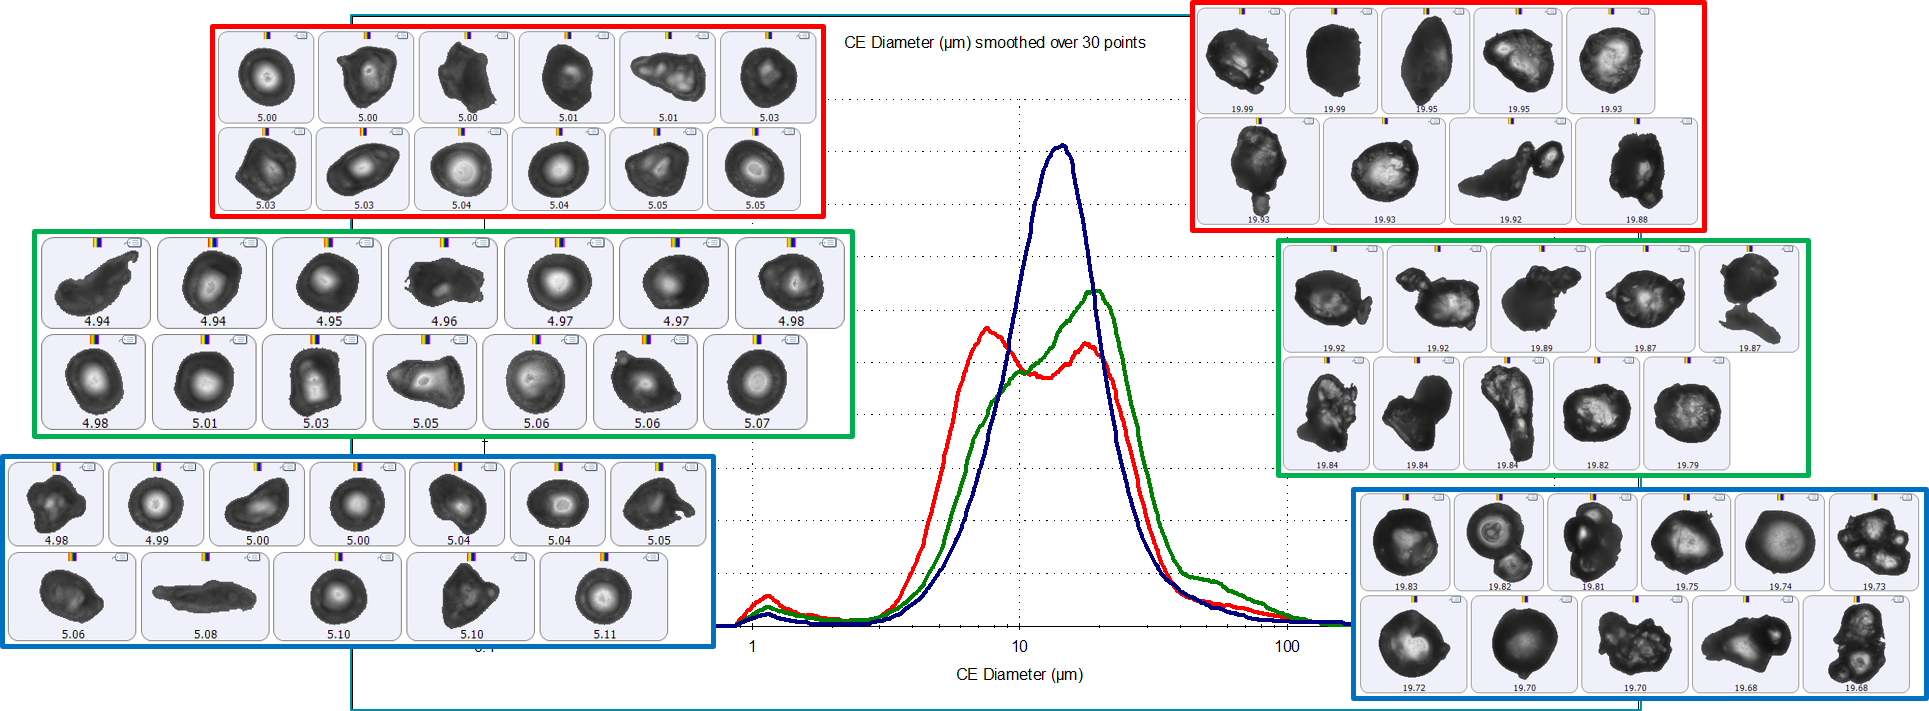
Figure 2: Circular equivalent diameter particle size distributions of the premium brand (red) and the supermarket brand (green) plain wheat flours and gluten-free flour (blue). The particle images are from the 10th (left hand side) and 90th (right hand side) percentiles of the distribution.
Each particle for which a Raman spectrum was acquired was classified based on the library spectrum with which its spectrum gave the best correlation (Figure 3). Starch was the most abundant of the components for all three samples, followed by starch-protein composite and then protein. This was then followed by the trace additives, such as gamma-oryzanol, calcium carbonate and sulfate.
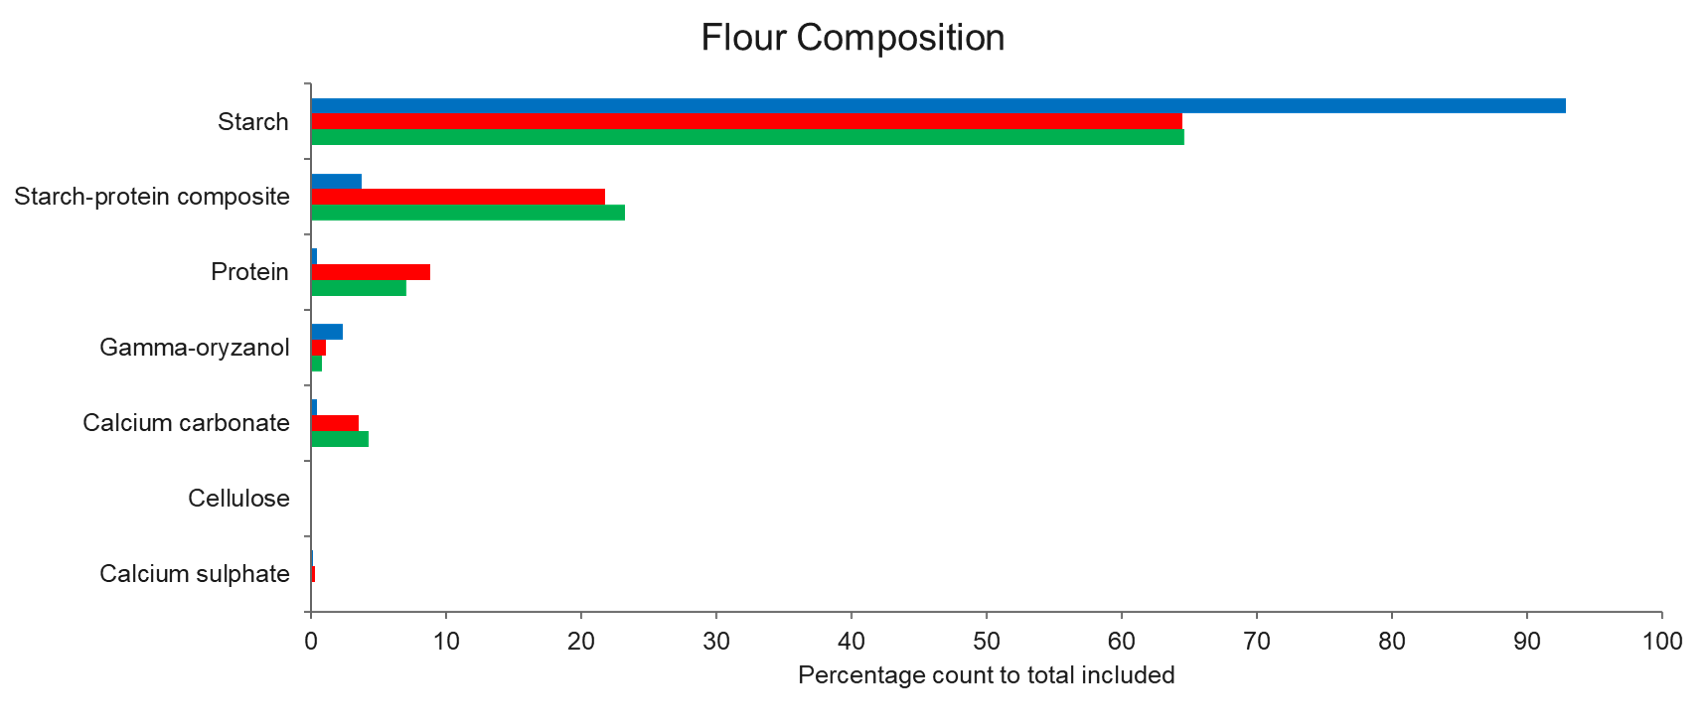
Figure 3: The percentage of total counted particles for each component identified by Raman, along with example particle images. Premium brand (red) and supermarket brand (green) plain wheat flours and gluten-free flour (blue).
In most cases, protein was agglomerated with starch to form composite particles, which may impact manufacturing processes such as the milling method. The gluten-free flour was shown to contain significantly less protein than the standard wheat flours, which is expected as there should be no gluten protein present. Gluten-free flour should not be devoid of protein, as this will affect the structural function of the flour, as well as the manufacturing performance.
When considering the starch component only (Figure 4), the bimodality of the particle size distributions for the premium and supermarket brand wheat flours became more apparent, and the modes were separated at 10 µm, in keeping with the A- and B-type populations. These two products have similar A- and B-type populations, so would be expected to have similar functional properties. Conversely, the particle size distribution of the gluten-free product remained monomodal but asymmetric, with a bias towards A-type particles (>10 µm). It is expected that the gluten-free flour would have a higher gelatinization temperature and would swell less as a result of water ingress.
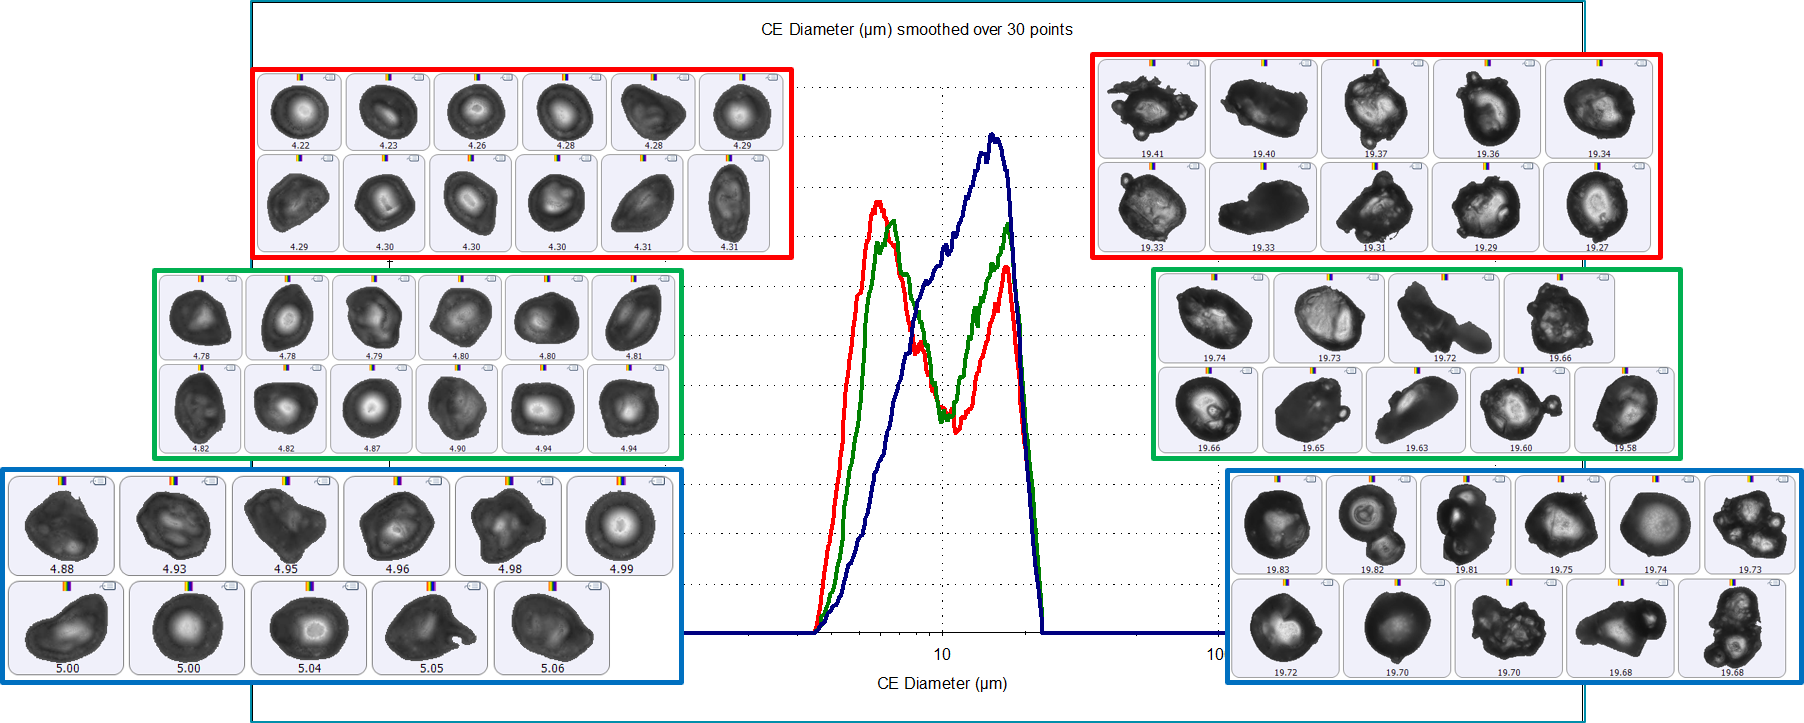
Figure 4: Circular equivalent diameter particle size distributions of the starch component of the premium brand (red) and the supermarket brand (green) plain wheat flours and gluten-free flour (blue). The particle images are from the 10th (left hand side) and 90th (right hand side) percentile of the distribution.
Again, the larger particles appeared more satellited and irregular in shape compared to the more spherical smaller particles. This could be seen more clearly when comparing the circularity of the A- and B-type particles from the premium brand and supermarket brand wheat flours (Figure 5). The blue and brown undersize plots are from the B-type particles, and show a higher level of circularity than the red and green plots of the A-type particles.
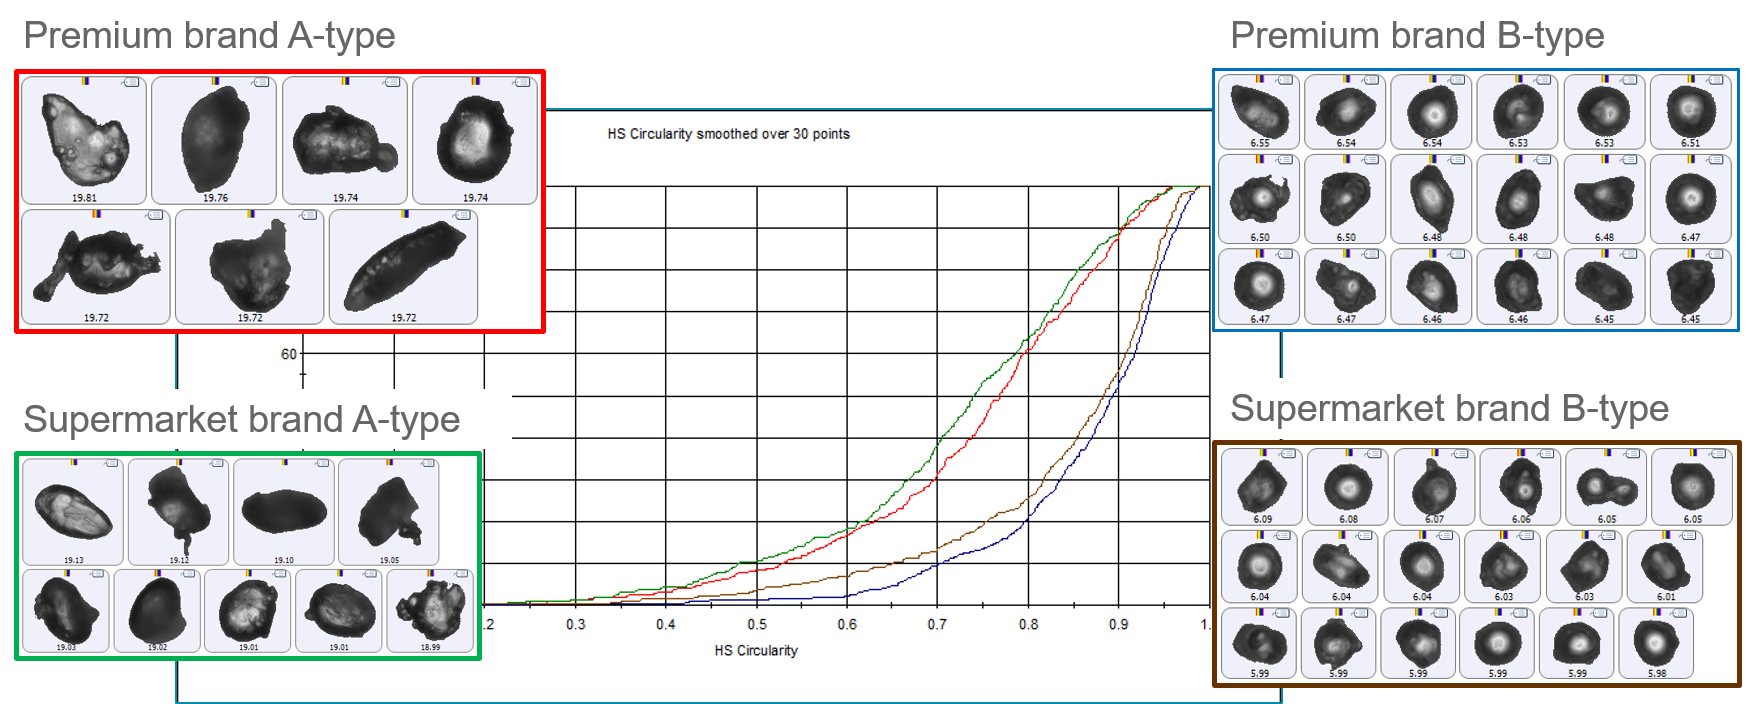
Figure 5: High Sensitivity (HS) Circularity distribution (top) and undersize chart (bottom) of premium brand A-type (red), B-type (blue) granules, supermarket brand A-type (blue) and B-type (brown) granules.
When comparing particle elongation between the three flour products, the undersize chart of the gluten-free flour showed that these particles were notably less elongated than those of the premium and supermarket brand wheat flours (Figure 6). The example images of the particles also show a more spherical shape for the gluten-free flour compared to those from the two wheat flours. This may be related to the protein content of this flour, and may therefore be an indication of the structural and manufacturing performance of the flour.
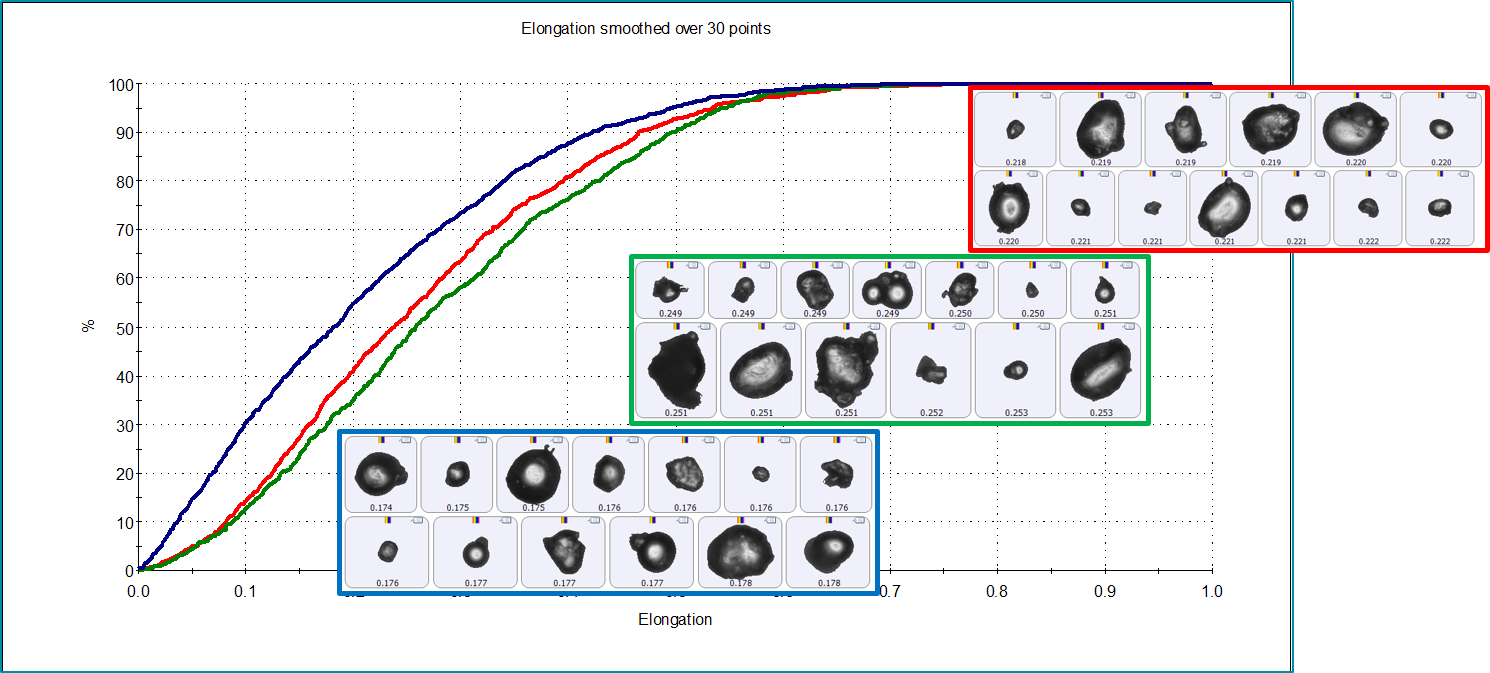
Figure 6. Elongation undersize chart for particles from the premium brand (red) and the supermarket brand (green) plain wheat flours and the gluten-free flour (blue).
The starch component of the wheat flours from the premium and supermarket brands had equivalent bimodal particle size distributions, characterized by populations of A- and B-type particles. The gluten-free flour not only contained less protein, but also had a monomodal particle size distribution, which was biased towards A-type particles. The relative proportion of these two particle types and the quantity of protein in the composition will influence the functional and nutritional properties of the dough made from the flours. Hence, the dough made from gluten-free flour is unlikely to perform equivalently to the wheat flours and so may need a different preparation or recipe.
1. https://www.researchandmarkets.com/reports/4775823/wheat-flour-market-global-industry-trends?utm_source=CI&utm_medium=PressRelease&utm_code=2dhwcw&utm_campaign=1275891+-+Global+Wheat+Flour+Markets%2c+2011-2018+%26+2019-2024&utm_exec=chdo54prd accessed December 2019
2. https://www.tridge.com/intelligences/wheat-flour/price accessed December 2019
3. Y. Zhang, Q. Guo, N. Feng, J-R. Wang, S-J. Wang, Z-H. He, Characterization of A- and B-type starch granules in Chinese wheat cultivars, J. Integr. Agric. 2016, 15(10): 2203-2214.
4. Q. Liu, Z. Gu, E. Donner, I. Tetlow, M. Emes, Investigation of Digestibility In Vitro and Physicochemical Properties of A- and B-Type Starch from Soft and Hard Wheat Flour, Cereal Chem. 2007, 84(1): 15-21
5. J. Zeng, G. Li, H. Gao, Z. Ru, Comparison of A and B Starch Granules from Three Wheat Varieties, Molecules 2011, 16, 10570-10591.