In recent years, additive manufacturing (AM) has evolved from a prototyping tool to a still new, but established and economically viable choice for component production. Annual sales of metal AM machines have grown from fewer than 200 in 2012 to almost 2,300 in 2018 as the aerospace, energy, automotive, medical, and tooling industries have embraced the technology [1]. The use of AM in manufacturing is driving growth in the market segment dedicated to metal materials – which is expected to account for a quarter of the market by 2023 [2].
AM offers several advantages compared with alternative powder metallurgy methods, ranging from design flexibility to the potential for high material use efficiency, and is particularly suitable for producing small to medium volumes of relatively small components, as well as enabling the creation of complex parts that were previously unachievable. The development of AM machines is an important focus area as the technology is adapted to produce larger components and deliver higher throughputs. However, there is now an equal emphasis on the properties of the powders used.
Up to one-third of the production cost of an AM component is the cost of the powder used, with commercial viability resting on establishing a robust supply chain and effective powder recycling strategies. Identifying analytical tools that can reliably set specifications for AM metal powders to validate quality and manage their use is vital. In this white paper, we review the key processes used in AM, how they determine the requirements of metal powders for this application, and how they can be measured.
AM is ‘the process of joining materials to make objects from 3D model data, usually layer upon layer, as opposed to subtractive manufacturing methodologies such as machining’. As a tool-less manufacturing technique, it offers superior design freedom to any other and, uniquely, similar scalability for making one part or many. Other benefits include the possibility to create lightweight structures and build multicomponent parts in one step, reduced material consumption compared with machining, and short production cycle times. To fully utilize these potential benefits, manufacturers need to understand the process just as they would any other, the properties of material inputs, and interactions between the two, to exert effective control.
There are several alternative technologies used within AM machines, each subjecting a metal powder to different flow, stress, and processing regimes. Therefore, matching powder characteristics to any specific application/machine is crucial. The most common commercial technologies can be classified as powder bed or blown powder. A brief overview of how these processes work is useful in setting powder requirements in context.
Powder bed AM processes involve constructing the component on a progressively retracting platform, with a fresh layer of powder spread across the bed following the selective fusing of specified areas. With laser powder bed fusion (PBF), a laser beam is used to locally melt the upper layer of the spread powder. PBF machines vary in terms of, for example, build volume and the number of lasers used, and are suitable for a wide range of materials including titanium, nickel and aluminum alloys, stainless and tool steels, and cobalt chrome. That said, build times are slow – in the order of 25g per hour – so a primary aim is to reduce processing times.
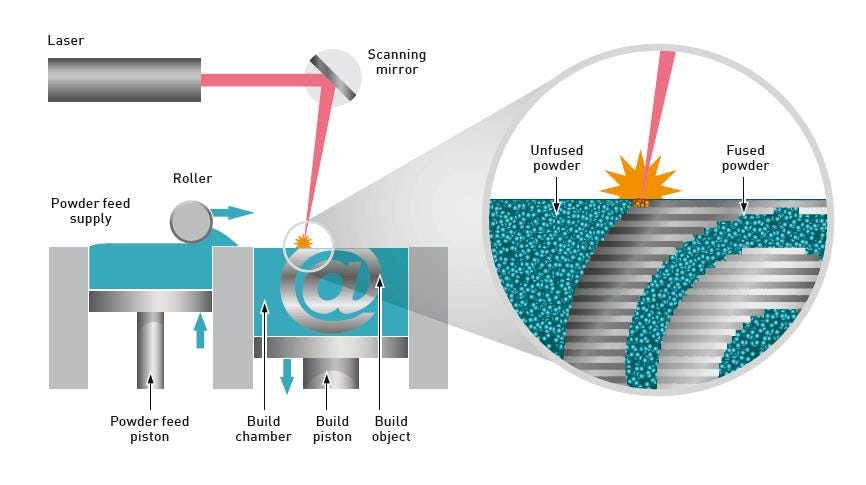
Figure 1. Powder bed AM processes such as PBF call for rapid, even powder spreading and effective recycling of the excess powder
In recent years, additive manufacturing (AM) has evolved from a prototyping tool to a still new, but established and economically viable choice for component production. Annual sales of metal AM machines have grown from fewer than 200 in 2012 to almost 2,300 in 2018 as the aerospace, energy, automotive, medical, and tooling industries have embraced the technology [1]. The use of AM in manufacturing is driving growth in the market segment dedicated to metal materials – which is expected to account for a quarter of the market by 2023 [2].
AM offers several advantages compared with alternative powder metallurgy methods, ranging from design flexibility to the potential for high material use efficiency, and is particularly suitable for producing small to medium volumes of relatively small components, as well as enabling the creation of complex parts that were previously unachievable. The development of AM machines is an important focus area as the technology is adapted to produce larger components and deliver higher throughputs. However, there is now an equal emphasis on the properties of the powders used.
Up to one-third of the production cost of an AM component is the cost of the powder used, with commercial viability resting on establishing a robust supply chain and effective powder recycling strategies. Identifying analytical tools that can reliably set specifications for AM metal powders to validate quality and manage their use is vital. In this white paper, we review the key processes used in AM, how they determine the requirements of metal powders for this application, and how they can be measured.
AM is ‘the process of joining materials to make objects from 3D model data, usually layer upon layer, as opposed to subtractive manufacturing methodologies such as machining’. As a tool-less manufacturing technique, it offers superior design freedom to any other and, uniquely, similar scalability for making one part or many. Other benefits include the possibility to create lightweight structures and build multicomponent parts in one step, reduced material consumption compared with machining, and short production cycle times. To fully utilize these potential benefits, manufacturers need to understand the process just as they would any other, the properties of material inputs, and interactions between the two, to exert effective control.
There are several alternative technologies used within AM machines, each subjecting a metal powder to different flow, stress, and processing regimes. Therefore, matching powder characteristics to any specific application/machine is crucial. The most common commercial technologies can be classified as powder bed or blown powder. A brief overview of how these processes work is useful in setting powder requirements in context.
Powder bed AM processes involve constructing the component on a progressively retracting platform, with a fresh layer of powder spread across the bed following the selective fusing of specified areas. With laser powder bed fusion (PBF), a laser beam is used to locally melt the upper layer of the spread powder. PBF machines vary in terms of, for example, build volume and the number of lasers used, and are suitable for a wide range of materials including titanium, nickel and aluminum alloys, stainless and tool steels, and cobalt chrome. That said, build times are slow – in the order of 25g per hour – so a primary aim is to reduce processing times.

Figure 1. Powder bed AM processes such as PBF call for rapid, even powder spreading and effective recycling of the excess powder
A schematic of a typical PBF machine is shown in Figure 1. The metal powder is stored in a hopper and progressively exposed to the spreading or recoater roller by a rising piston. The roller spreads the exposed powder across the bed to create a thin, uniform layer about 20 to 50 microns deep, with the excess captured in a secondary container for reuse/recycling. A cycle of spreading, melting, and fractional platform retraction is repeated up to thousands of times to build the finished component, layer by layer.
With electron beam melting (EBM), the metal powder is fused using a high-energy (3kw) electron beam, which means processing must take place in a vacuum chamber. This chamber is typically maintained at an elevated temperature (~700°C [1,300°F]), which has the advantage of making the resulting parts almost free from residual stresses, an important gain in terms of product quality. On the other hand, the use of an electron beam can charge the metal particles, causing them to repel and form a cloud or ‘smoke’ around the working area. This undesirable effect is prevented by forming a pre-sintered cake in which the component is constructed. This means powder recycling with an EBM process is complicated by the additional need to break up the cake to return the metal powder to a usable form. Commercially, EBM is less widely used than PBF; there are fewer machines available and a more limited range of materials that can be used.
Binder jetting processes can be considered a ‘subset’ of powder bed technology since they operate in a very similar way. However, in binder jetting, a liquid binding agent is used to join the metal powder particles rather than them being melted or fused through the application of heat. This results in the formation of a ‘green’ part that is removed from the printer. Metal solidification is then achieved in a second debinding/sintering step.
While EBM reduces residual stresses in the finished part by heating the component during construction, binder jetting processes eliminate the thermal gradients that cause such stresses because they do not employ heat at all. Finished components are, therefore, largely free of residual stresses. Binder jetting can also be more cost-effective than other AM technologies. However, the materials available are more limited than for PBF, as are the mechanical properties achievable in the finished component.
In blown powder processes, such as directed energy deposition (DED) (or laser metal deposition), the powder is blown through a nozzle at a relatively high pressure in a carrier gas stream, into a melt pool on the specified surface. A laser beam forms the melt pool and is automatically moved across the substrate as required. DED processes offer higher productivity relative to PBF/EBM and enable the construction of larger-scale components, but are unsuitable for the construction of features such as internal channeling and lattice structures [3]. These processes can also be used to make repairs and augment the functionality of existing components with controlled precision.
AM processes are typically operated with essentially ‘fixed’ parameters for a specific application, with machines currently offering little opportunity for any responsive control. This means inconsistent input material properties directly cause inconsistent finished component properties. Poor powder quality can produce defects in the finished component such as pores, cracks, inclusions, residual stresses, and suboptimal surface roughness, but also compromise throughput. Understanding the correlations between material properties, processing performance, and end component properties is, therefore, essential, to select the best powder for an application and to ensure the consistency of that powder – from build to build, layer to layer, and through recycling [4]. This raises the question of which properties are important in terms of defining a robust powder specification.
Chemistry is paramount. Powder needs to comply with the alloy composition of the material specified, and grade must be carefully selected to control the interstitial elements present such as oxygen or nitrogen, which can impact the properties of the finished component. In addition, AM powders must be free from foreign particulate contamination such as other material batches at the powder production plant, the AM facility, or debris in processing/recycling equipment. Contaminant levels of just a few parts per million can have a significant impact on component quality.
A simple and fast way to analyze chemical composition and impurities in metal powders is X-ray fluorescence (XRF). XRF can measure elemental composition and impurities both in powder samples, as loose or pressed pellet, or as fused beads or melt casted discs. Although inductively coupled plasma (ICP) analysis is widely used for analyzing metals and metal powders, it may not always be the best tool for this. Requiring sample digestion, dilution, and daily calibration, ICP is a laborious and therefore expensive method for metal and metal powder analysis. Particularly for the chemical composition analysis, where the main elements are at a level of a few percentage points, XRF can measure samples as such, without any need for dilution. Other advantages of XRF include a small footprint, ease of operation, no need for high-purity gases, and a minimal expertise requirement. Accurate quantitative analysis in XRF requires calibration with standards. However, calibration on XRF can last for more than a year before recalibration is needed. XRF is a suitable replacement for ICP in many cases, but where ICP is still needed for specific trace elements, XRF is a highly complementary as it can perform the majority of analysis, limiting the amount of ICP analysis required and streamlining the workflow.
The basic principle of XRF analysis is simple. If we expose a sample with a beam of X-rays, it will cause secondary X-rays (fluorescence) to be generated within the sample. These X-rays have energies (or wavelengths) that represent the elements present in the sample. In other words, by measuring the energies Ei (or wavelengths li) of X-rays that come out of the sample, we can tell what elements are present. The characteristic energies for each element in the periodic table are well documented. For example, if 7.7 keV X-ray photon comes out of the sample, then Co is present, and 8.3 keV photon means Ni is present, and so on.
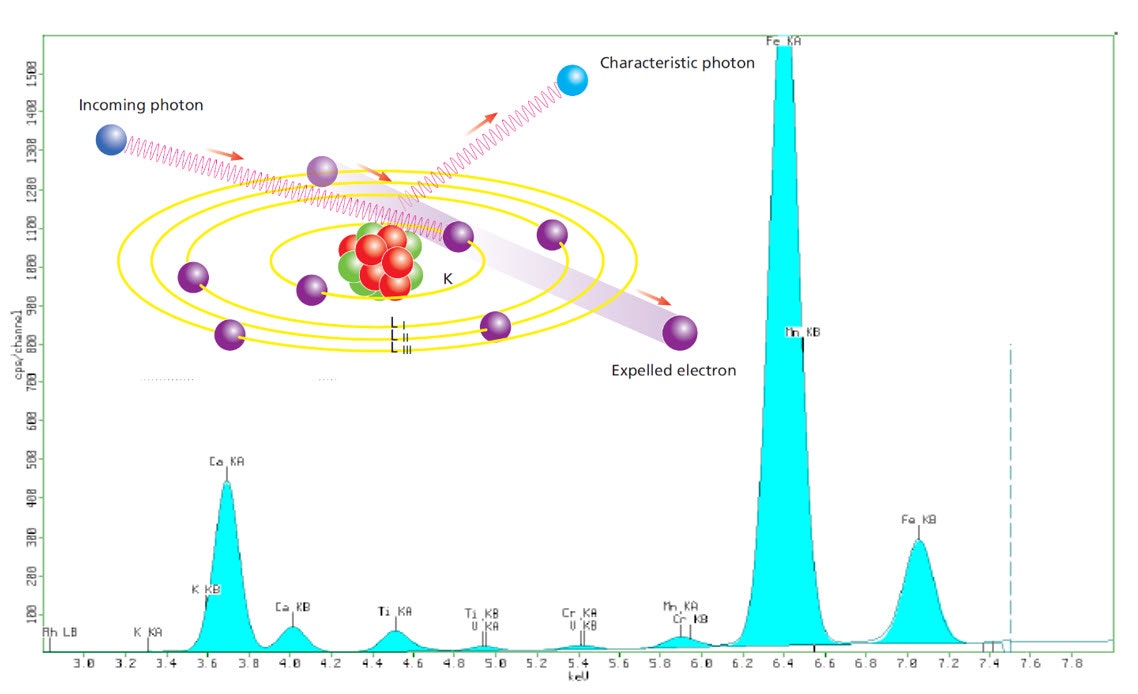
Figure 2. Illustration showing the basic principles of X-ray fluorescence and embedded in a typical XRF spectrum
Under carefully controlled conditions, we can count the number X-ray photons coming from each element over a period, for example, one minute, and use this to calculate the proportions of each element in the sample. A powder sample can be presented as a loose powder, pressed powder, fused glass bead, or melt casted disc, while formed parts can be measured directly or cut to a suitable size.
Broadly speaking, there are two types of X-ray spectrometers – energy dispersive (EDXRF) and wavelength dispersive (WDXRF). The geometric differences between the types are shown below.
EDXRF – In an EDXRF system (2D optics), X-rays irradiate the sample and the fluorescence coming out of the sample is measured by an energy-dispersive detector. Usually, the detector is a Peltier cooled Si (Li) or Ge solid state detector. EDXRF usually has a high sensitivity to high z-elements and can typically measure elements from F to U. Some advanced EDXRFs can measure elements down to carbon (C). Because EDXRF measures all the elements simultaneously, low source power is sufficient for high counting statistics. Usually, the limiting factor in EDXRF is the count rate handling of the detector, and high source power may saturate the detector and is thus not recommended.
WDXRF – In a WDXRF system, the X-ray tube irradiates the sample, and the fluorescence coming out of the sample is detected by the detector. However, the detection system comprises a collimator, a diffraction crystal, and a detector. X-rays coming from the sample pass through a collimator and fall on a crystal. Crystal disperses different wavelength X-rays in different directions. Another collimator placed at a certain angle selects one of the wavelengths that gets measured by the detector. WDXRF has superior sensitivity to light elements and is recommended when light elements below Na are to be measured with high accuracy. However, WDXRF requires high source power as the measurement is sequential. Despite the high power, the detector in WDXRF does not saturate as the beam is pre-filtered by the crystal and fluorescence from only one element falls onto the detector at a given time.
Table 1 shows the average composition for three samples of Inconel 718 using a benchtop EDXRF system compared with the nominal composition for the alloy as stated in ASTM F3055 [5].
Element | Average composition Inconel 718 (%) | Nominal composition of Inconel 718 (%) |
|---|---|---|
Ni | 54.8 | 50-55 |
Cr | 18.8 | 17-21 |
Fe | 16.8 | 17 |
Nb | 5.0 | 4.75-5.5 |
Mo | 3.0 | 2.8-3.3 |
Ti | 0.9 | 0.65-1.15 |
Mn | 0.2 | <0.35 |
Al | 0.2 | 0.2-0.8 |
Si | 0.2 | <0.35 |
Beyond chemistry, the physical characteristics of a metal powder define AM performance. These characteristics include bulk properties of the powder and properties of the individual metal particles. The key bulk properties are packing density and flowability. Powders that pack consistently well to give a high density are associated with the production of components with fewer flaws and consistent quality. Flowability, on the other hand, is arguably more closely associated with process efficiency. The ability to spread evenly and smoothly across a bed to form a uniform layer with no air voids is essential for PBF processes, for example, while consistent flowability under very different conditions, as an aerated powder stream, is required for DED. These requirements intensify as processing speeds are increased.
Bulk density and flowability are directly, though not exclusively, influenced by morphological characteristics such as particle size and shape. The range of particle characteristics known to influence flowability, for example, includes stiffness, porosity, surface texture, density, and electrostatic charge. Figure 3 illustrates the relationship between aspects of particle shape and powder flowability [6]. Generally speaking, smooth, regular-shaped particles flow more easily than those with a rough surface and/or irregular shape. Rougher surfaces result in increased interparticle friction while irregularly shaped particles are more prone to mechanical interlocking; both effects decrease flowability. Similarly, spherical particles tend to pack more efficiently than irregular particles, leading to higher bulk densities [7]. The bulk powder property requirements for AM, therefore, suggest sphericity is likely to be highly prized, and this is widely recognized within the industry.
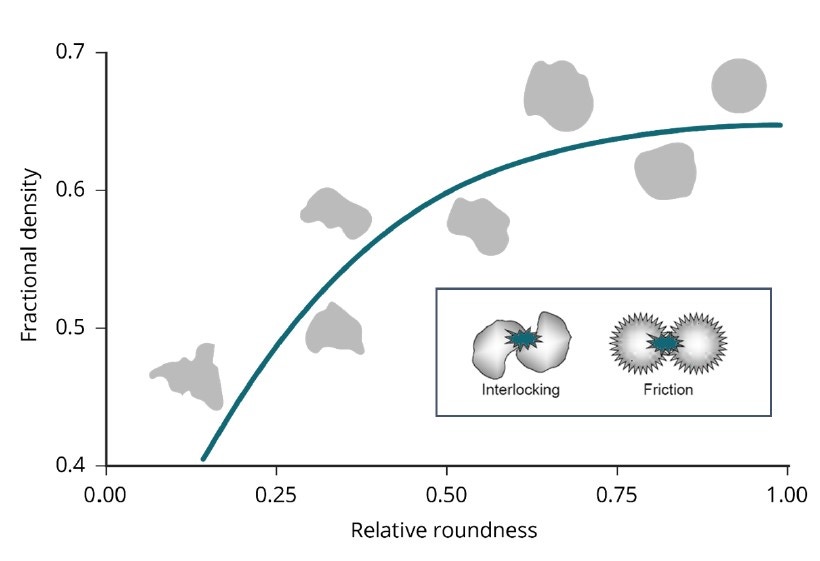
Figure 3. Smooth, regularly shaped particles tend to flow more easily than those that are irregular and/or rougher, because of reduced friction and a lower risk of mechanical interlocking
When it comes to particle size, AM metal powders need to be fine so they can, for example, meet the requirement to form a powder bed just tens of microns thick. However, fine-ness can be problematic from a health and safety perspective and in terms of flowability. Because the forces of attraction between particles increase with decreasing particle size, finer powders are usually less free-flowing than coarser analogues, although optimizing particle shape can help mitigate this effect [6, 8]. In terms of packing, Figure 4 shows how particle size and particle-size distribution are influential. Maximum packing density is achieved with a distribution that includes coarse and fine particles, with finer particles increasing density by filling the gaps left by larger ones [7]. This is illustrated in Figure 4.
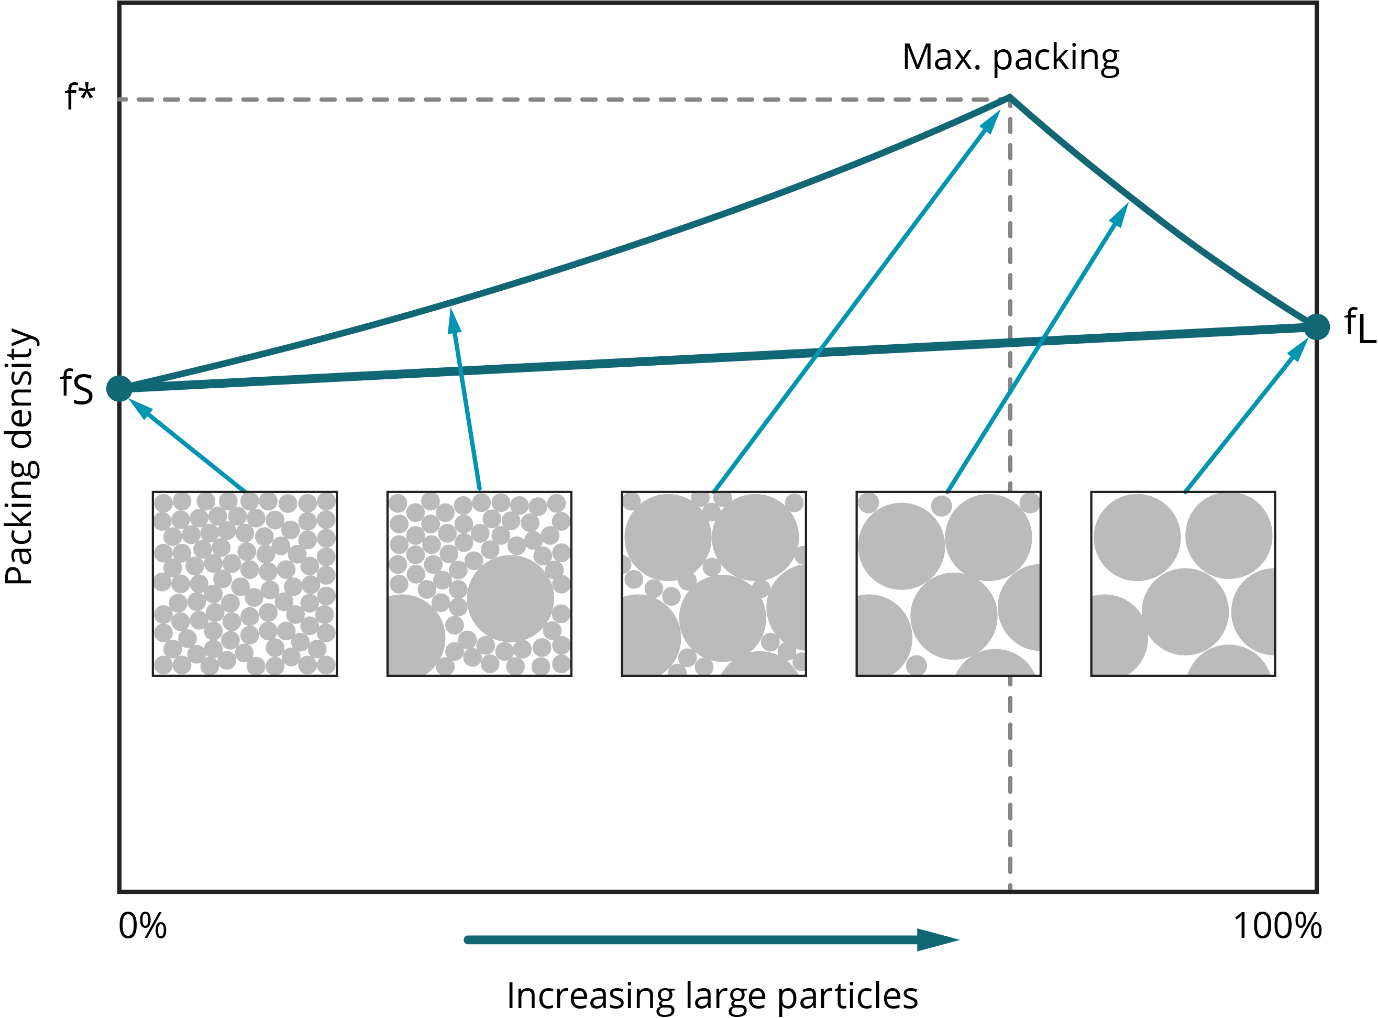
Figure 4. Packing density reaches a maximum when the particle size distribution includes both fine and coarse particles
Metal powder manufacture substantially predates AM and many chemically consistent products are available on the market, the majority of which are manufactured via atomization processes. This means particle size fraction and particle shape can be closely specified, but often at a price. In particular, the cost of highly spherical metal powders is substantially higher than those containing particles that are more irregularly shaped. Measuring powders and particles to determine exactly what is required for a given process is the key to achieving beneficial performance at a competitive cost [4].
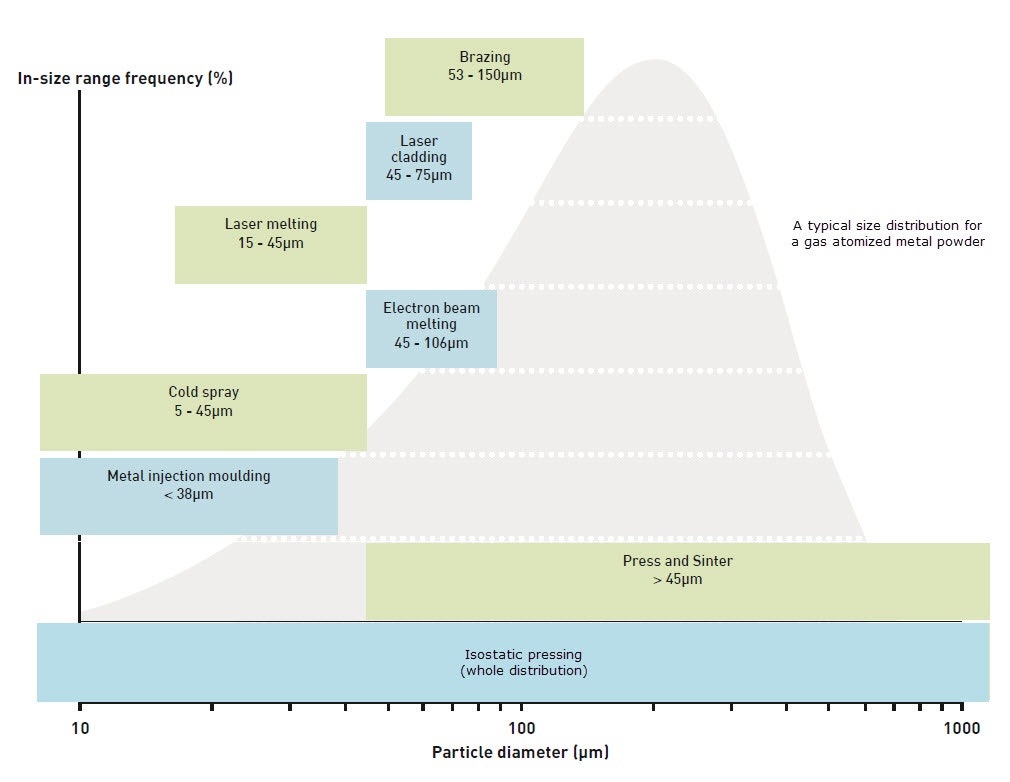
Figure 5. Typical as-atomized particle size distribution of gas atomized powders including required size distributions for various advanced powder metallurgy manufacturing technologies
As stated previously, a spherical particle shape is preferred for powder bed additive manufacturing as it confers better particle packing and flowability. Gas-atomized particles are relatively spherical but may exhibit many unwanted features such as satellite formation, in which small and larger particles can fuse or agglomerate during atomization to form irregular shapes. This is a problem not only for flowability and packing, but also because the satellite particles are so small (usually 1-10 microns) that, if detached, can become an airborne health and safety risk. More spherical particles can be produced by plasma atomization or the plasma rotating electrode process (PREP), but at a higher cost.
With a measurement range between 0.01 and 3,500 µm, laser diffraction is the particle sizing technology of choice for most AM applications – particularly the smaller size ranges. Laser diffraction systems determine particle size from the resulting light-scattering pattern as a collimated laser beam passes through the sample, as shown in Figure 6. Large particles scatter with high intensity at narrow angles relative to the incident beam, while smaller particles generate a weaker signal that extends to wider angles. Laser diffraction analyzers calculate the particle-size distribution of the sample using the measured angular dependence of the scattered light based on an appropriate theory of light scattering, generally Mie theory.
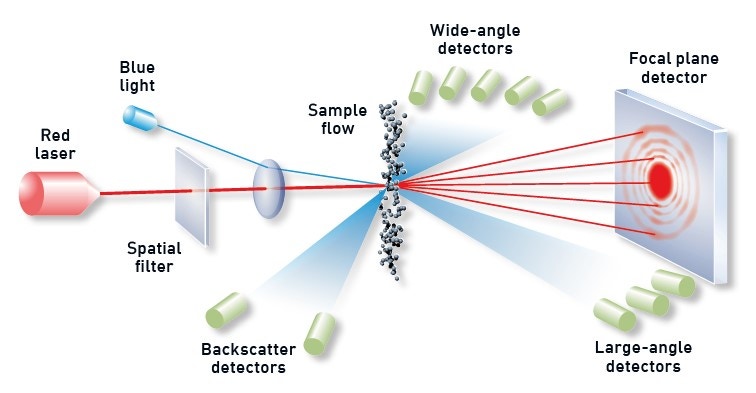
Figure 6. Illustration showing the principle behind a laser diffraction measurement with diffracted light from dispersed particles picked up by optimally positioned detectors
Modern laser diffraction systems such as the Mastersizer 3000 are highly automated, to the point of push-button operation, and offer high throughput analysis with minimal manual input. As well as the laboratory-based laser diffraction systems, there are online process systems such as Insitec that deliver real-time monitoring of particle size for automated process control. These can be used to monitor particle size evolution during the atomization, grinding, or spray-drying process, or at an end-user facility for automated powder handling and recycling [9].
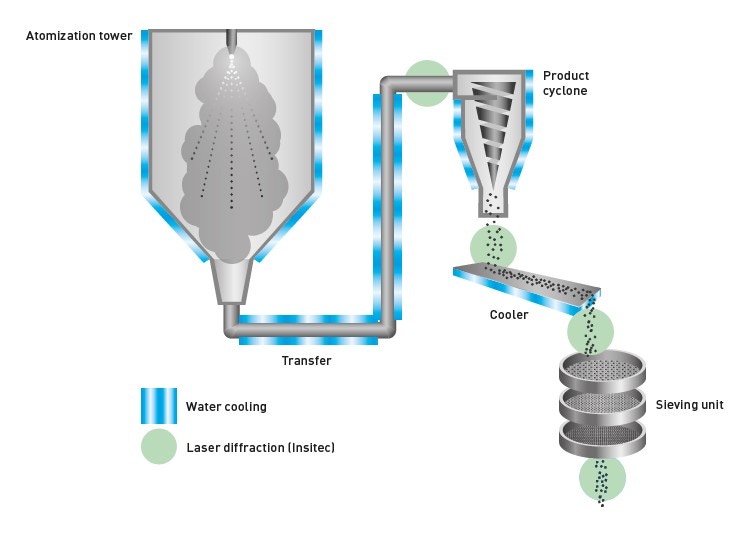
Figure 7. Schematic of a gas atomization process for manufacturing metal powders
Figure 8 shows measurements for four fractions of metal powders made using both wet and dry dispersion on the Mastersizer 3000. Wet or dry dispersion can be used for metal powders and should give equivalent results if dispersion procedures are optimized and sampling is comparable. For the <150µm fraction in Figure 8, there is a noticeable discrepancy between wet and dry measurements, which is considered to be due to fine particles adhering to larger particles in the dry state or a difference in sampling [10].
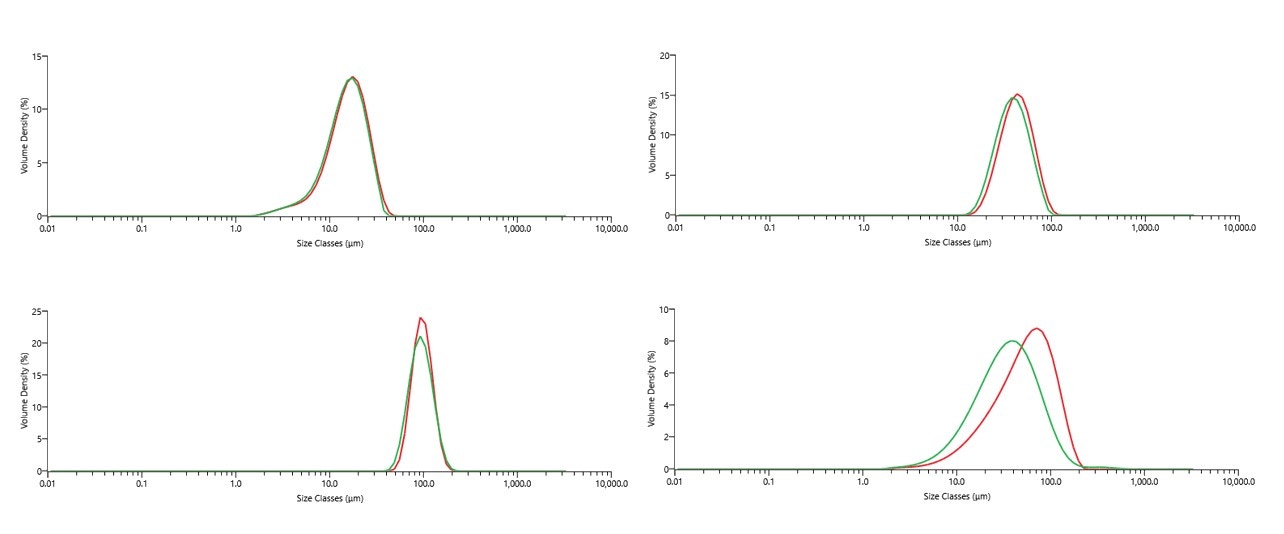 Figure 8. Comparisons of wet and dry measurements for each stainless steel 316L powder sample. In each case, red trace is the dry measurement PSD and green trace is the wet measurement PSD (each PSD shows the average result over five measurements)
Table 2 shows a comparison between Mastersizer 3000 (lab analyzer) and Insitec (on-line analyzer) measured with dry dispersion for four size fractions of a stainless steel powder. Insitec and Mastersizer result in good agreement for all fractions, with Insitec results <2% higher [11].
< 25 µm | 20 – 64 µm | 64 – 150 µm | < 150 µm | |||||
|---|---|---|---|---|---|---|---|---|
Matersizer 3000 | Insitec | Matersizer 3000 | Insitec | Matersizer 3000 | Insitec | Matersizer 3000 | Insitec | |
d10 | 7.46 | 7.11 | 25.3 | 24.9 | 68.9 | 67 | 16.7 | 16.5 |
d50 | 15.9 | 16.5 | 42.3 | 44.2 | 94.7 | 94.2 | 54.7 | 56.7 |
d90 | 27.0 | 27.2 | 68.2 | 70.0 | 131 | 134 | 117 | 122 |
Three standout techniques are commonly used to characterize the particles in additive layer manufacture: dynamic image analysis, automated static image analysis, and scanning electron microscopy (SEM). The simplest way to differentiate these techniques is by comparing the number of particles imaged and the resolution of those images [12]:
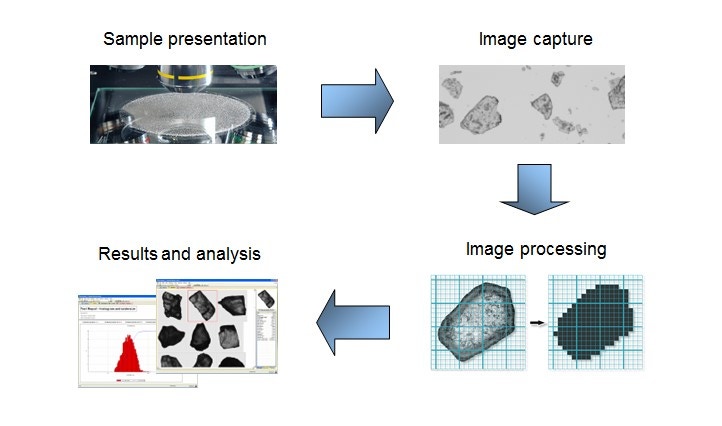
Figure 9. Illustration showing the general workflow for an automated imaging measurement
Suitable for particles from ~0.5 µm to >1 mm, automated imaging offers particle size and shape measurement on a statistically rich ensemble of particles – either as dry powder dispersion or as dispersion in a liquid medium. Automated imaging is an efficient technique for generating data to comprehensively optimize metal particle morphology. Automated imaging systems capture individual images of tens of thousands of particles in a dispersed sample within minutes. Figure 9 shows the general workflow for an automated imaging measurement and Figure 10 shows some typical particle morphologies as revealed with this workflow.
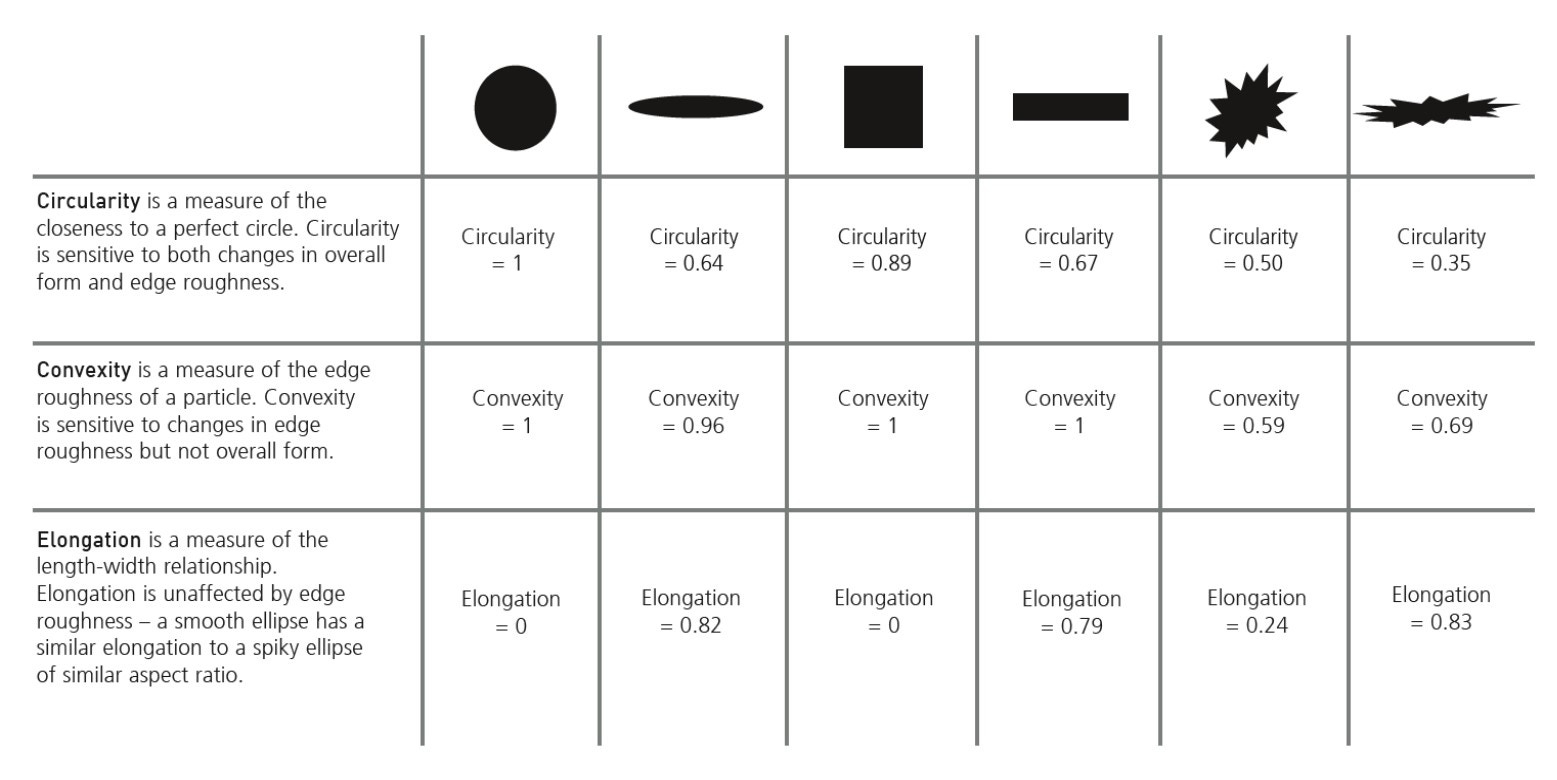 Figure 10. Particle morphology parameters revealed through automated image analysis
Multiple size and shape parameters are calculated for each particle and used to build up statistically significant number-based distributions. The most commonly used shape parameters are circularity (particle perimeter/perimeter of an equivalent-area circle) and high-sensitivity circularity (perimeter/perimeter of an equivalent-area circle)2, although customized classifications can be set up to look at satelliting, for example. Figure 11 shows several metal powder images taken with Morphologi 4 that have been automatically classified and grouped based on their shape, such as how spherical or elongated they are or whether they have satellites [13].
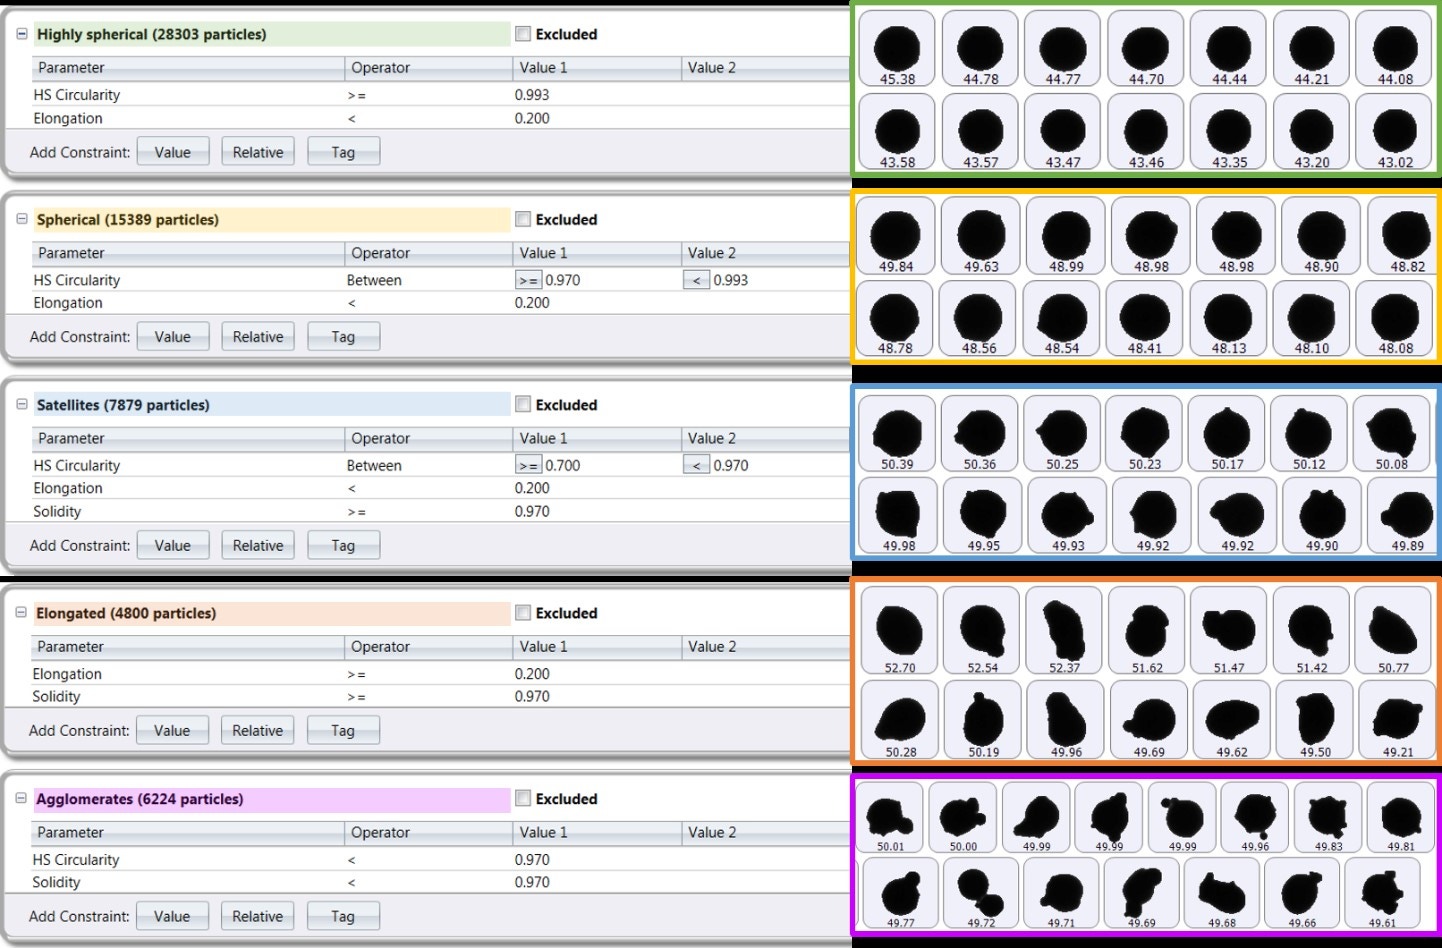
Figure 11. Particle classifications for an AM metal powder with corresponding particle images
In terms of metals, microstructure usually refers to phases and grain structures present in the metallic material and is critically important since it directly impacts the properties of the final component and, ultimately, its performance. The microstructure depends on the elemental composition of the metal or alloy, but also the thermal and mechanical stresses the metal is exposed to during processing.
For metal fabrication processes such as casting, forging, and isostatic pressing, the heating-cooling regimes are more prolonged, controlled, and homogenous. However, for powder bed additive manufacturing such as SLM, EBM, and DED, the heating-cooling regimes are very fast and location-specific, which can lead to different microstructures than those obtained with conventional processes, even with the same alloy composition. For example, a metal alloy powder gas atomized with a different heating-cooling regime or different atomizing gases can produce products with a different phase composition and, therefore, different mechanical properties. When this powder is melted and rapidly recrystallized during an EBM or SLM process, there is further potential for phase transformation to occur. Post-treatments such as heating, machining, and isostatic pressing can further change the material.
It is not only the phase composition that can be affected by processing conditions, but also the grain structure. It is more difficult to control grain structure in an AM manufactured part during processing due to rapid and localized heating-cooling regimes, and this often results in large grain sizes compared with other methods. Most engineers and metallurgists are looking for a fine grain structure since this improves material strength. This is why post-treatment is still commonplace for many metal AM processes, although that may soon change as technology and process understanding improve. Grain orientation (also known as texture) is also important, with components supposedly preferring a textured grain orientation. As with grain size, texture correlates with mechanical properties such as chemical reactivity, strength, and deformation response and can lead to weaknesses and premature failure. A better understanding of the EBM, SLM, and DED processes and how these affect material properties can open the door to innovative new materials. For example, it is possible to produce single-crystal alloys using powder bed fusion processes, and researchers are exploring ways to manipulate the local microstructure by controlling the energy density of the laser or electron beam.
Residual stress is another important characteristic of AM parts that correlates with microstructure. Residual stresses are stresses that are retained in a component after manufacture and act in addition to any externally applied stress, increasing the risk of mechanical failure. AM components can be more prone to residual stress due to the nature of the process, which involves highly localized and rapid phase transformations that give insufficient time for stress relaxation to occur. Residual stresses can occur anywhere in a material, but those located near a crack, pore, or at the surface of a component are of greatest concern since this is where stresses become most concentrated.
X-ray diffraction is a nondestructive analytical technique used to identify and quantify phases in a material. The term “phase” refers to a material with a distinct atomic structure, determined by what atoms are in the phase and how they are arranged. Every crystalline phase produces a characteristic diffraction pattern (e.g. fingerprint), even phases that are chemically identical. Figure 12 shows the atomic structures and diffraction patterns for different phases of steel. A pure material will show one of these diffraction patterns while a mixture of the three phases will show characteristics of all three diffractograms with peak height indicative of the relative concentrations.
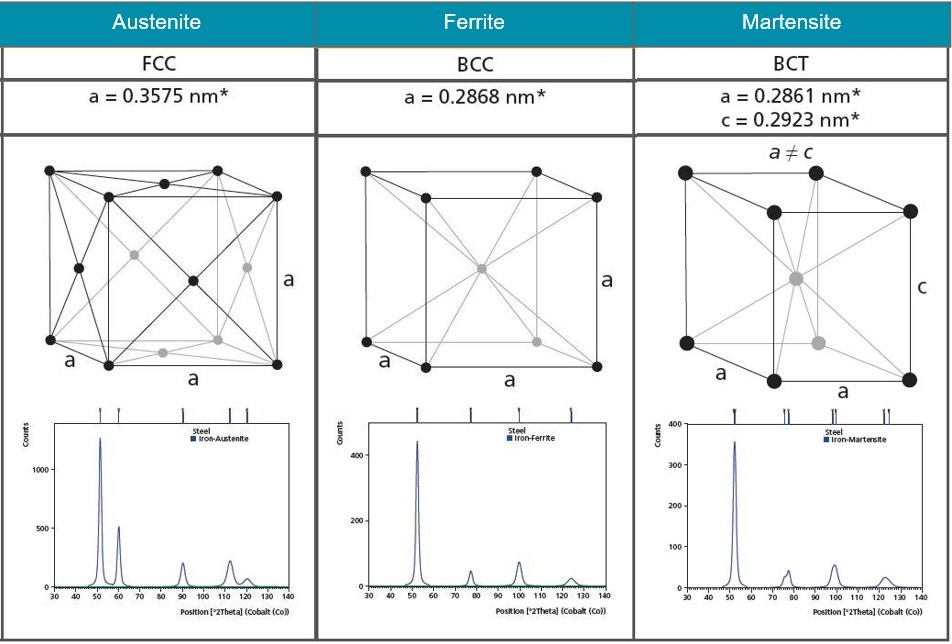
Figure 12. Illustrations of the crystal structures of Austenite, Ferrite and Martensite and their corresponding diffraction patterns
The characteristic diffraction pattern is created when incident X-rays are scattered by the orderly three-dimensional arrangement of atoms in a crystal, producing an interference effect that constructively reinforces the X-ray beam at specific directions and results in a diffraction peak, as illustrated in Figure 13. The diffraction peak is produced based on the interatomic spacing, as defined by Bragg’s law. It is these reinforced diffracted X-rays that produce the characteristic X-ray diffraction pattern that is used for crystal structure determination.
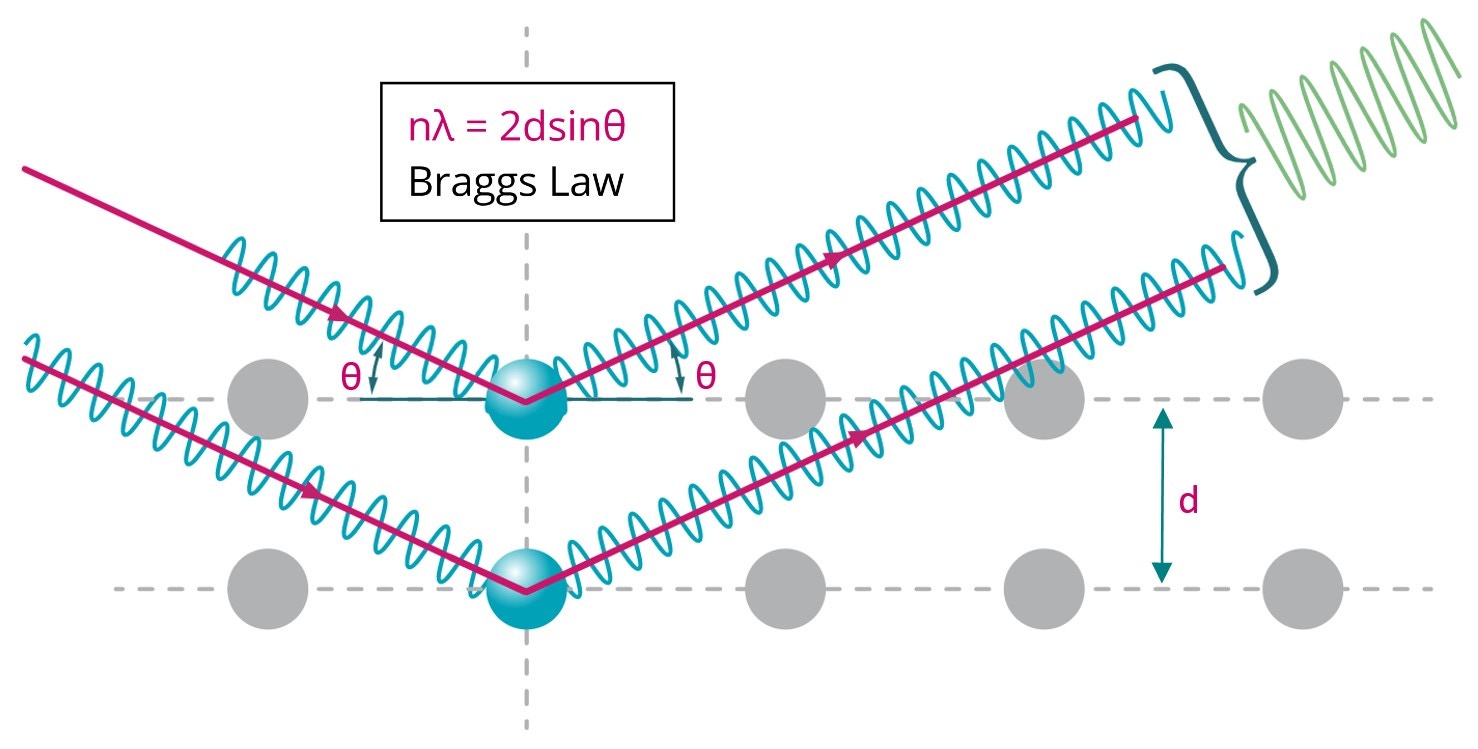
Figure 13. Illustration of Bragg diffraction in which two beams with identical wavelength and phase are scattered off two atoms with spacing d to give constructive interference
In addition to phase analysis, X-ray diffraction can be used to analyze several microstructural features that will affect the diffraction pattern. Texture creates variations in peak intensity; residual stress creates variation in peak position; and crystalline size and defect concentration creates variations in peak width.
Texture is produced when grains are not randomly oriented, but instead have a preferred crystallographic orientation produced by processing conditions. Traditionally, rolling and extruding metals creates specific textures that are used to strengthen alloys in specific directions. Likewise, control of texture can be beneficial in additive manufacturing. Texture produces systematic deviations of peak intensity from the characteristic diffraction pattern of a phase. The intensity deviation can be used to quantify the fraction of grains in a certain orientation. By tilting and rotating the sample, mounted onto a diffractometer, the intensity distribution of a reflection over the orientation sphere - a pole figure - can be recorded. When a set of pole figures for independent crystal orientations has been measured, the orientation distribution function (ODF) of the crystallites can be calculated.
Residual stress is created when processing conditions do not allow the grains to relax to their equilibrium crystal structure. A tensile or compressive stress will change the atomic spacing of a phase, which will produce a shift in the diffraction peak position. This can be measured with high sensitivity by X-ray diffraction. A series of measurements determine how peak position varies with sample orientation relative to the incident X-ray beam, which can then be used to precisely determine the atomic strain. If the elastic constant of the material is known, then the stress can be calculated from the measured strain.
Small crystallite sizes produce a broadening effect in diffraction peak width that can be used quantify crystallite sizes <200 nm. This makes X-ray diffraction a powerful technique to quantify the size of nanocrystalline materials. Peak broadening may also be produced by defects, such as dislocations or stacking faults, that are created during processing. Analysis of multiple diffraction peaks can be used to separate and quantify the size and defect broadening.
Figure 14 shows an X-ray diffraction pattern for an Inconel 718 powder measured using an Empyrean X-ray diffractometer, as reported by Mostafa et al[14]. This shows that the powder contains a Ni-Cr solid solution (γ phase) and the bct-Ni3Nb, γ" phase. The volume fractions of these two phases were calculated to be about 85% and 15%, respectively.
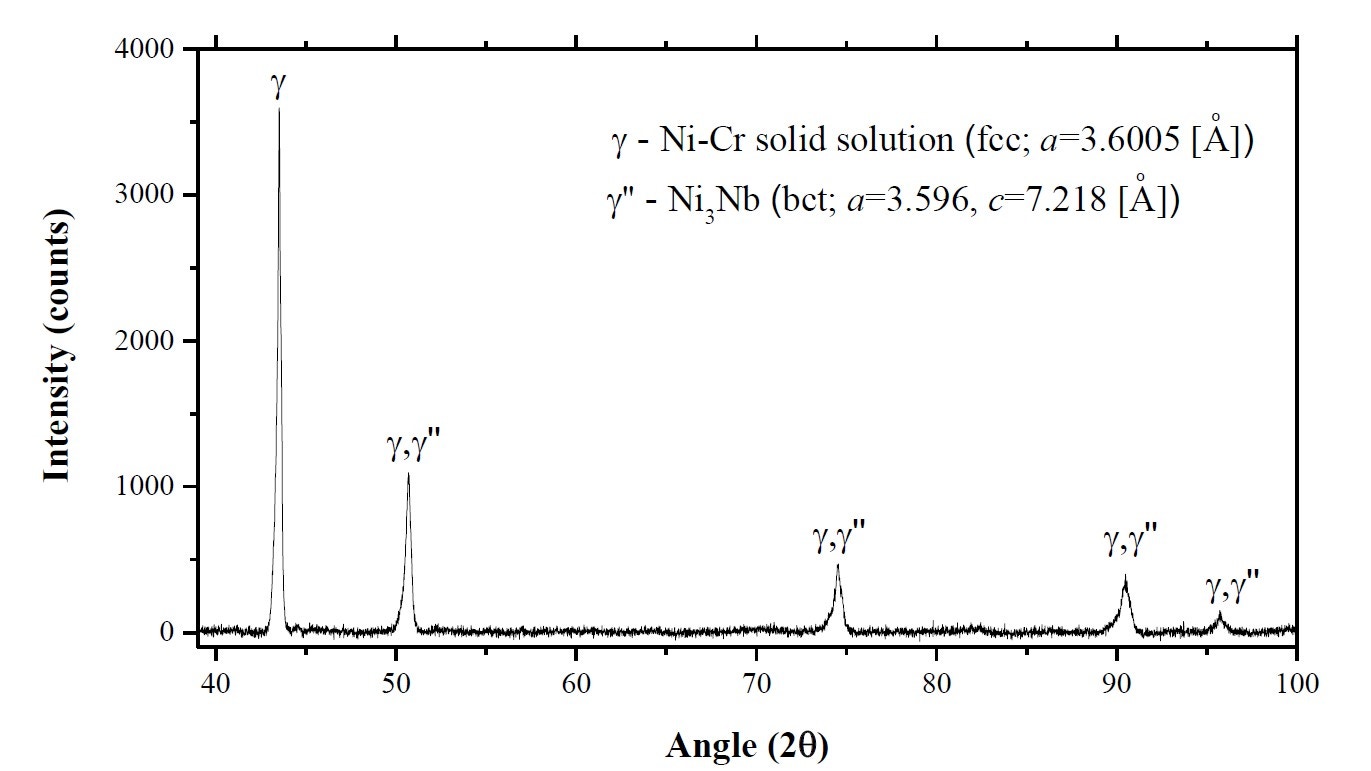
Figure 14. X-ray diffractometer (XRD) spectrum for the IN718 powder sample as reported by Mostafa et al [14]
The purpose of this study was to investigate how the structure, texture, and phases in Inconel 718 are affected by the selective laser melting (SLM) process and two post-treatments – homogenization (1,100°C [2,012°F], 1 h) and hot isostatic pressing (HIP) (1,160°C [2,120°F], 100 MPa, 4 h).
Figure 15 shows the XRD spectra of the as-printed, homogenized, and HIP-treated cylindrical specimens. From the XRD results, two phases were positively identified in the SLM-printed specimen as γ phase and γ" (bct-Ni3Nb), indicating that the SLM process has induced a phase change in the starting powder. The diffractogram for the homogenized heat-treated specimen indicates that part of the columnar grains have grown and changed orientation to form equiaxed grains with a texture in [111] direction, while the other grains remain in the [002] direction. More equiaxed grains are formed after HIP treatment, and the diffraction pattern now shows a dominant texture in the [111] and [022] direction.
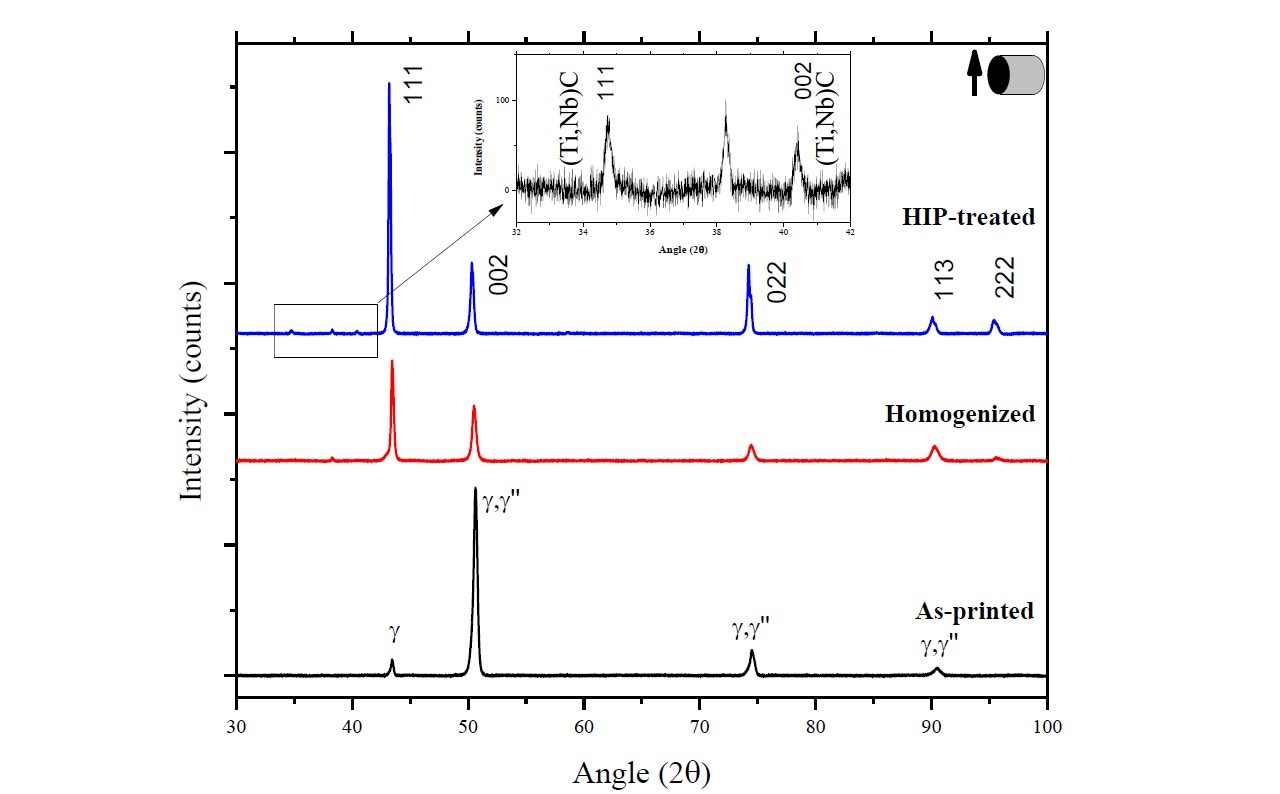
Figure 15. XRD spectra of as-printed, homogenized and HIP-treated Inconel 718 specimens as reported by Mostafa et al [14].
This work demonstrates the microstructural changes that can occur in a material during a powder bed fusion process and any post-treatment and how XRD can be used to quantify these changes.
[1] Wohlers Report 2020. 3D Printing and Additive Manufacturing State of the Industry. Annual Worldwide Progress Report
[2] SmarTech Publishing ‘The Top Three addiitve Manufacturing Predictions for 3D printing in 2017’
[3] European Powder Metallurgy Association, www.epma.com
[4] The importance of powder quality in powder bed Additive Manufacturing processes: A Malvern Panalytical webinar available for viewing.
[5] ASTM F3055-14a, Standard Specification for Additive Manufacturing Nickel Alloy (UNS N07718) with Powder Bed Fusion, ASTM International, West Conshohocken, PA, 2014, www.astm.org
[6] DF. Heaney, Handbook of metal injection molding, Woodhead Publishing, 2012
[7] J.P. Bennett & J.D. Smith, Fundamentals of Refractory Technology (Ceramic Transaction Series), Volume 25, 2001 (American Chemical Society)
[8] C.N. Davies, Aerosol Science, Academic Press, London and New York, 1966
[9] J. DeNigris, “Taking control of metal powder properties: Exploring the benefits of real-time particle sizing,” Met. Powder Rep., 73, No. 4, 202–207 (2018).
[10] Determining the particle size distribution of metal powders using wet and dry dispersion on the Mastersizer 3000: A Malvern Panalytical Application Note available for download
[11] M. Tulley, S. Hall, U. M. Attia, J. Dawes, J. Ashby, and G. Thornton, Feasibility Assessment of Using In-Process Measurement Analysers for Metal Powders, Euro PM2019
[12] 8 reasons why it’s time to upgrade to automated imaging: A Malvern Panalytical White Paper available for download
[13] Characterising the particle size and shape of metal powders for Additive Layer Manufacturing: A Malvern Panalytical Application Note available for download
[14] A. Mostafa, I. Picazo Rubio, V.Brailovski, M Jahazi, M Medraj. Structure, texture and phases in 3d printed IN718 alloy subjected to homogenization and hip treatments. Metals. 2017;7(6):196.