Taylor Dispersion Analysis is an ultra-low volume, microcapillary flow technique for sizing and stability of biomolecules in complex solutions, and offers advantages for orthogonal and complementary biophysical characterization measurements
Taylor Dispersion Analysis (TDA) is a microcapillary flow-based technique whereby a nanoliter-scale sample pulse is injected into the laminar flow of run buffer, which then spreads out axially due to the combined actions of convection and radial diffusion. Detection of the equilibrium concentration profile (or Taylorgram) of the dispersed sample pulse allows the molecular diffusion coefficient and hence hydrodynamic radius of solute molecules to be calculated.
An instrument implementation utilising a UV area array detector in combination with two detection windows enables selective, mass-weighted sizing of small molecules, peptides and proteins, and samples with mixtures of these species. The TDA technique further lends itself to novel (label-free) analysis of the interactions, conformation and stability of proteins and other target molecules within complex biologically-relevant media e.g. excipient and/or surfactant-laden bioformulations, and aggregated solutions.
Taylor Dispersion Analysis (TDA) is a fast and absolute method for determining the diffusion coefficients (and hence the hydrodynamic radii) of molecules. The method, sometimes referred to as Taylor-Aris dispersion, was first described by Taylor in his classic paper1, where he measured the dispersion of a pulse of solute injected into a flowing fluid in a capillary. In 1956, Aris developed the method further by accounting for the longitudinal diffusion of the molecules2.
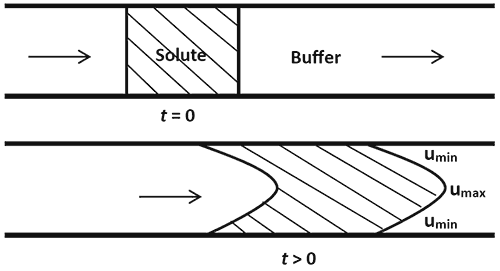
Taylor’s deduction was based on his observation that the dispersion of the solute occurs via a combination of the radial diffusion of the molecules and convection due to the cross-sectional velocity of the fluid. A pressure-driven fluid in a cylindrical tube flows under Poiseuille laminar conditions3. This implies that the velocity of the fluid decreases radially from a maximum umax at the centre of the cylinder to a minimum umin at the walls of the cylinder. The effect of this velocity distribution on the profile of an injected solute pulse is illustrated in Figure 1.

Figure 1: Axial spreading of the solute due to convection
The axial spreading of the solute pulse along the direction of flow (indicated by the arrows) is illustrated in Figure 1. This is known as convection. The front and back ends of the pulse which start out as sharp interfaces become parabolic in shape due to the laminar flow of the fluid. In the absence of any other dispersion mechanism, the axial spreading will continue in time and the solute molecules will be increasingly dispersed over the length of the tube i.e. the injected solute pulse would develop an asymmetric concentration distribution.
Diffusion is the movement of solute molecules from regions of higher concentration to regions of lower concentration. Hence, it is often thought of as a spreading mechanism. Counterintuitively, however, the role of radial diffusion (i.e. diffusion perpendicular to the fluid flow) in Taylor Dispersion is to limit the axial spreading due to convection. Figure 2 illustrates why this is the case.

Figure 2: The role of radial diffusion
The directions of the radial diffusion of the solute molecules are highlighted in Figure 2. At the front end of the pulse, the solute concentration is higher at the centre of the cylinder than at the cylinder walls. Hence, the solute molecules diffuse radially toward the cylinder walls. Since the solute molecules at the centre are travelling much faster than the molecules at the walls, the average axial velocities of these molecules are reduced by the diffusion. At the rear end of the pulse, the solute concentration is higher at the walls than at the centre, so the molecules diffuse radially toward the centre. This results in an increase in the average axial velocities of the diffusing solute molecules. Overall, the effect of radial diffusion is to slow the leading interface and accelerate the trailing interface thereby keeping the solute distribution more compact in the axial direction than it would have been under convection alone. The axial spreading due to the combination of both radial diffusion and convection ultimately results in the injected solute pulse developing a symmetrical concentration distribution, and is known as Taylor Dispersion.
From the preceding discussion, it can be deduced that solutes with small diffusion coefficients will be dispersed more than those with larger diffusion coefficients and vice versa. This is because whilst the diffusion coefficient (and hence the amount of diffusion) varies with the type of molecule, the amount of convection experienced is the same for all molecule types.
It should be noted that the solute molecules also diffuse in a direction parallel to the flow. Typically, this contribution is small in comparison to the overall axial dispersion. However, it was quantified by Aris in 1956 and in cases where it is accounted for, the mechanism is known as Taylor-Aris dispersion2.
As described above, the amount of dispersion of a solute in a stream of solvent is inversely related to its diffusion coefficient. The amount of dispersion is a function of both the time elapsed as well as the position of the solute within the flow. This relationship is described by Equation 1 which relates the variation of the solute concentration C in time t to its variation with its axial position x along the capillary. Note that C is the solute concentration averaged across the capillary diameter in the direction y, perpendicular to the flow axis x as illustrated in Figure 3.
 Equation 1

Figure 3: The concentration is averaged over the y-direction, perpendicular to the flow axis x
The constant k is known as the dispersion coefficient and is related to the diffusion coefficient D by:
 Equation 2
where r is the capillary radius and u is the mean speed of the fluid flow.
Note the inverse relationship between the dispersion and diffusion coefficient as predicted qualitatively in Section 1. The hydrodynamic radius Rh is inversely related to the diffusion coefficient via Stokes’ law and is given by:
 Equation 3
where kB is Boltzmann’s constant, T is the temperature and h is the viscosity of the solvent.
There are a range of possible solutions to Equation 1 which depend on the initial conditions. The solutions describe the evolution of the concentration profile as a function of time and space during the dispersion. An example of such a solution is illustrated in Figure 4.

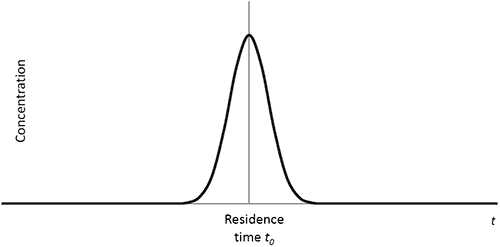
Figure 4: The concentration profile resulting from the injection of a small nanoliter-scale sample pulse
The concentration profile (or Taylorgram) in Figure 4 arises when the sample is initially concentrated within a small region at point x = 0. At a later time t, the concentration C at a point x, further along the capillary, is given by:
 Equation 4
where C0 is the initial sample concentration and t0 = x/u is known as the residence time and is approximately equal to the time of peak concentration in Figure 4.
Equation 4 is commonly referred to as the time-dependent Gaussian distribution. At large values of t, it is approximated by a Gaussian distribution:
 Equation 5
where the dispersion coefficient k is related to the width of the Gaussian σ by
 Equation 6
The derivation of Equations 4 and 5 is based on the assumption that the initial concentration C0 is located in an infinitesimally small region at the point x = 0. Since this is impossible to achieve in practice, a correction4 is usually applied to Equation 6 to account for the finite width of the injected sample. However, the need for the correction can be avoided by measuring the dispersion at two points along the capillary. This is because the dispersion coefficient can be deduced by comparing the evolution of the dispersion between the two observation points. In this scenario, the dispersion coefficient is related to the widths of the two Gaussians, σ1 and
σ
2, and the residence times, t1 and t2 by:
 Equation 7
This is commonly referred to as the two-window solution.
For the solutions in Equations 2, 4, 5 and 7 to be valid, two other conditions must be satisfied5. The first condition requires the observation time t to be much greater than the time required for the solute molecules to diffuse radially across the capillary. This can be expressed in terms of the dimensionless residence time τ as:
 Equation 8
The second condition requires the axial diffusion of the solute to be negligible when compared to its dispersion. This can be expressed of the Peclet number Pe as:
 Equation 9
The second condition is not required for Taylor-Aris dispersion since the effect of axial diffusion is accounted for. The Taylor-Aris solution2 amounts to replacing Equation 2 with Equation 10.
 Equation 10
As the analysis given above highlights, the technique is absolute under the run conditions specified, and no calibration is required.
Whilst Taylor Dispersion Analysis has its origins in the 1950s, the advantages it can offer as an orthogonal and complementary technique to existing and established analysis methods in R&D workflows (such as DLS and SEC-MALS) have not been widely recognised in the field to date.
The Malvern Viscosizer system provides rapid determination of hydrodynamic radius to enable mass-weighted sizing of protein-based and small molecule systems in biological formulations by Taylor Dispersion Analysis with UV-selective detection. Complementary to these TDA-based measurements, the system also enables relative viscosity measurements in microcapillary flow on the same sample. All test protocols run under automated methodologies and require very small sample volumes (35µl total sample required for triplicate measurements for both sizing and relative viscosity on one sample).
Molecular sizing by Taylor Dispersion Analysis is optimal in the range 0.2nm to 50nm for hydrodynamic radius – spanning small molecules, peptides and proteins, and association states of these molecules e.g. aggregation or molecular interactions.
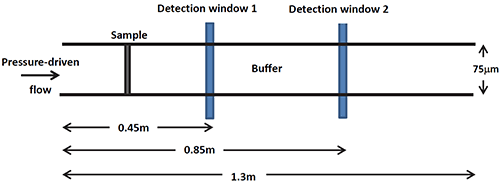
Using an ultra-violet (UV) light imaging array, the absorbance of an injected sample is measured as a function of time as it is pressure-driven through a narrow bore fused-silica capillary with two detection windows. The diameter of the capillary is about 75µm and the run pressure is typically set to 140mb for size measurements. These, along with the positions of the two detection windows, have been chosen so that the two conditions listed in Section 2 are satisfied for a wide range of typical hydrodynamic radii. The measurement baseline is set using the run buffer – typically the buffer or formulation matrix that the target molecule of interest is dissolved in.
The ability of the technique to baseline against the run buffer, and then selectively assess the size and behaviour of target molecules only in the injected sample pulse opens up novel experimental capabilities for label-free analysis in complex, biologically-relevant matrices e.g. monitoring drug molecules in serum. In addition, the capability to assess the viscosity of such complex sample matrices on the same instrument is valuable complementary data for diffusion coefficient.
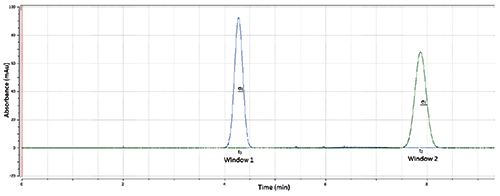
A schematic of the measurement set-up is shown in Figure 5 and examples of the absorbance profiles obtained are shown in Figure 6. The absorbance is recorded in milliabsorbance units (mAu).

Figure 5: A schematic of the Malvern Viscosizer measurement set-up

Figure 6: A Taylorgram showing the absorbance profiles at the two detection windows.
The Beer-Lambert law6 establishes the relationship between the UV absorbance A of a sample and its concentration C:
 Equation 11
where e is the extinction coefficient which is molecule-dependent and l is the path length of the light through the sample. The absorbance profile of a sample is therefore proportional to the distribution of its concentration and can be used to measure its dispersion within the capillary (and as such, knowledge of the sample concentration is not needed).
With the Malvern Viscosizer, the width s and residence time t0 of a Taylorgram are obtained by fitting a model based on Equation 4 to the absorbance profile. The two-window solution (Equation 7) is then used to determine k and hence the diffusion coefficient D and the hydrodynamic radius Rh of the sample (Equations 2 and 3).
In addition to determining the hydrodynamic radii of a homogenous sample, the Taylor Dispersion method can also be applied to the analysis of multi-component mixtures such as monomer and dimer or other oligomeric species, or aggregated samples. For a multi-component mixture, the calculated hydrodynamic radius from a single fit to the Taylorgram is a weighted average of the individual hydrodynamic radii. Hence, variations and trends in the estimated hydrodynamic radii can be used to indicate a change in the proportion of oligomers or aggregates in a sample.
To improve on this, the contributions to the Taylorgram of the each component of the sample may be fitted individually. The radii and relative proportions of the components may then be estimated respectively from the widths and areas of the constituent Taylorgrams and the results used to quantify the amount of oligomerisation or aggregation in the injected sample.