
Données ITC de valeur N
Ne jetez pas vos données ITC de valeur N « mauvaises »
La valeur N, communément appelée stœchiométrie, est souvent utilisée pour qualifier une titration comme « bonne » ou « mauvaise ». Le raisonnement est le suivant : « si ma valeur N est différente de 20% ou plus par rapport à la stœchiométrie attendue (souvent 1), alors les résultats de ma titration sont invalides ». En réalité, ce n’est pas toujours le cas. Il est important de comprendre que la valeur N de l’ITC n’est pas la même chose que la stœchiométrie (rapport de liaison). La valeur N est effectivement égale à la stœchiométrie si les concentrations utilisées pour l’ajustement sont correctes et 100% actives. Une façon d’exprimer la valeur N est la suivante :

Chacune des trois valeurs de cette équation peut changer N, ce qui signifie que N est autant une mesure du rapport de liaison que de l’activité des échantillons. Deux de ces valeurs doivent être connues (ou supposées) pour obtenir la troisième. Par exemple, si l’on s’intéresse à la stœchiométrie, les concentrations fournies dans l’ajustement doivent être précises et 100% actives. Si l’on s’intéresse à l’activité de l’échantillon dans la cellule (souvent une protéine), la stœchiométrie et la concentration active de l’échantillon dans la seringue (ligand) doivent être supposées.
Considérez la FIG.1 :

Les concentrations fournies sont de 20μM de protéine (dans la cellule) et 200μM de ligand (dans la seringue), N=0.86. Probablement, l’une de ces deux concentrations (ou les deux) n’est pas précise, le rapport de liaison probable est soit 1:1 (N=1) soit 1:2 (N=0.5, 2 protéines : 1 ligand). Si nous supposons qu’il est de 1:1 et que le ligand de 200μM est correct, alors un nouvel ajustement des données avec 17μM de protéine portera N à 1, ce qui signifie que la concentration réellement compétente pour la liaison de la protéine est de 17μM. Dans le nouveau logiciel d’analyse de données PEAQ, l’une des trois inconnues (N, [protéine], [ligand]) peut être attribuée comme variable.
La valeur N peut être facilement visualisée comme la valeur de l’axe X au point médian (point d’inflexion) d’une courbe sigmoïdale ITC. Il y a certaines titrations qui n’ont pas de point d’inflexion clair – elles sont soit avec 1) une faible valeur C (courbe plate) soit 2) atteignent une saturation « trop tôt » soit parce que la concentration active dans la cellule est trop faible, soit parce que la concentration de ligand est trop élevée.
1) Dans le cas d’une faible valeur C, le problème est une faible affinité et de faibles concentrations résultant en une courbe plate. Considérez la FIG.2 :
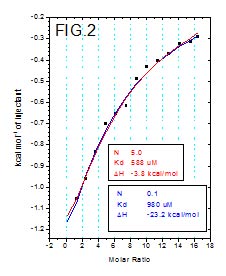
Kd est dans la gamme moyenne à élevée de μM, mais la concentration de protéine n’est que de 50μM, ce qui résulte en une courbe plate. Pour la transformer en sigmoïde avec un point médian bien défini, nous devons avoir des concentrations de protéines 10x (ou plus) au-dessus du Kd. Souvent, ce n’est pas une option, donc les chercheurs ont recours à la titration dite de faible valeur C – dans ce cas, la concentration de protéine est maintenue basse mais la concentration de ligand est augmentée pour que la courbe atteigne un certain degré de saturation (notez le rapport molaire élevé). Une telle courbe manque de point d’inflexion, donc la valeur N est inconnue et doit être supposée et fixée à une valeur constante lors de l’ajustement.
2) Dans le cas de la saturation « précoce » – le problème est des concentrations inexactes. La valeur N semble très petite. Par exemple, sur la FIG.3 :

Si nous laissons N varier lors de l’ajustement, nous obtiendrons une valeur de 0.0008, ce qui n’est certainement pas la stœchiométrie réelle. De plus, le ΔH est anormalement élevé (ΔH pour les interactions biologiques dépasse rarement 30 kcal/mol).
Comment extraire des données fiables de Kd et ΔH de telles titrations ? En effectuant des ajustements avec quelques valeurs extrêmes supposées de N et en enregistrant la variation de Kd et ΔH. Par exemple, nous pouvons supposer que la stœchiométrie de la FIG.2 se situe quelque part entre 0.1 et 5, basée sur la qualité raisonnable des ajustements que nous obtenons avec ces deux scénarios de frontière. Dans ce cas, le Kd varie très peu – de 980μM à 588μM respectivement. De même, pour la fig3, le Kd varie de 25μM à 37μM pour un N de 0.2 à proche de 0.
Bien que les courbes non sigmoïdales soient plus difficiles à analyser, elles ne doivent pas être rejetées comme des résultats inadéquats. Les valeurs de Kd peuvent ne pas être connues avec une certitude absolue, mais elles convergent généralement vers des valeurs dans une gamme relativement étroite, même lorsque l’incertitude de la valeur N (et par extension, des concentrations actives) est grande.
Ressources associées :
Inscrivez-vous à notre prochain webinaire sur l’analyse avancée des données ITC avec AFFINImeter : Comment obtenir des insights sur les modes d’interaction complexes avec l’ITC
Regardez le lancement en direct de la nouvelle gamme MicroCal PEAQ-ITC
{{ product.product_name }}
{{ product.product_strapline }}
{{ product.product_lede }}
