This datasheet investigates the capabilities of the Zetium 4 kW, a wavelength dispersive X-ray fluorescence spectrometer, as a tool to do Trace-analysis of Mercury in Iron-ore.
This datasheet investigates the capabilities of the Zetium 4 kW, a wavelength dispersive X-ray fluorescence spectrometer, as a tool to do Trace-analysis of Mercury in Iron-ore.
During the production of Steel Iron-ore is burned which causes the emission of Mercury into the air. In order to control this emission, the amount of Mercury in the Iron-ore must be known.
This application note demonstrates the analytical capability and stability of the Zetium to analyze Trace-levels of Mercury in Iron-ore.
A Zetium spectrometer, configured with 4 kW power, an X-Y sample handler, and advanced analytical software was used to generate the data presented in this datasheet. The system is engineered for excellence in terms of analytical accuracy, precision, and operational performance.
All samples were prepared as pressed pellets. 20.0 grams of dried sample material was mixed with 1.0 gram UltraWax ((CH2)n). After mixing, the powder was pressed for 30 seconds at 300 kN using a Herzog automatic press.
The used measurement program can be found in Table 1. The used time is the total time on both the peak and background positions.
| El. | Hg |
|---|---|
| Line | Lα1,2 |
| kV | 60 |
| mA | 66 |
| Filter | Al / 750 |
| Crystal | PX10 |
| Collimator | 300 µm |
| Detector | HScint |
| 2θ (°) | 35.8662 |
| Bg1 (°) | -1.1830 |
| Bg2 (°) | 0.9872 |
| PHD LL (%) | 40 |
| PHD UL (%) | 65 |
| Time (s) | 240 |
| Table 1: Measurement program to determine trace-levels of Hg in Fe-ore | |
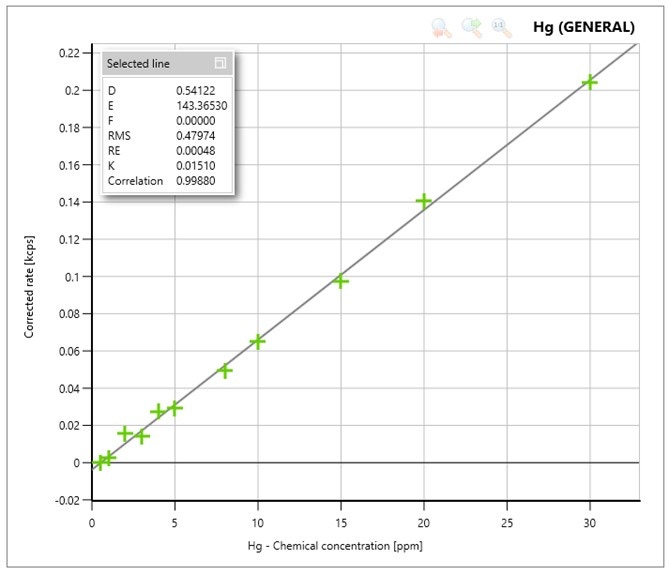
Figure 1 shows the calibration plot for Mercury. The measured intensities correspond with the expected concentrations in the samples, resulting in linear calibration curves.

Figure 1: Calibration curve for Hg
The calibration curve of Hg (Figure 1) was obtained using the channel settings as described in Table 1, with a measurement time of 120 seconds on the peak and 60 seconds on both background positions. In Table 2 the calculated Lower Limit of Detection (LLD) can be found.
| Calibration line | Min. LLD (ppm) | Standard | Max. LLD (ppm) | Standard | Av. LLD (ppm) |
|---|---|---|---|---|---|
| Hg | 0.63 | STD 10 | 0.66 | STD 02 | 0.64 |
| Table 2: Lower Limit of Detection (LLD) for Hg, based on 120 seconds measurement at the peak and 2x 60 seconds measurement time on the background positions | |||||
To show the precision of the method, three samples were measured for 20 repeat cycles including loading and unloading of the sample.
| Average Concentration Hg (ppm) | Min concentration Hg (pm) | Max concentration Hg (ppm) | RMS concentration (ppm) | |
|---|---|---|---|---|
| Sample 01 | 1.3 | 1.0 | 1.8 | 0.2 |
| Sample 02 | 2.9 | 2.4 | 3.6 | 0.4 |
| Sample 03 | 6.4 | 5.7 | 7.3 | 0.4 |
| Table 3: Results of 20 repeat cycles, RootMeanSquare (RMS) is the 1 sigma error | ||||
The data presented in this application note demonstrate the capability of the Zetium WDXRF spectrometer Trace-analysis of Mercury in Iron-ore. The used measurement channel result in a measurement time of just 240 seconds.
The perfect precision of the Zetium is proven with repeat measurements. The results illustrate the stability and robustness of the Zetium. The high sensitivity of the Zetium enables the very low limits of detection for Mercury.
Based on the data in this application note it may be concluded that the Zetium spectrometer is perfectly suited for the trace analysis of Mercury in Iron-ore. Based on a measurement time of 240 seconds on Hg, an LLD of 0.64 ppm can be reached. The standard deviation close to the LLD is just 0.3 ppm.