Spidroins are large, structural proteins that make up the bulk of spider silk fibres. This application note describes the use of a Zetasizer Nano ZSP to characterize their stability at different temperatures.
Spidroins are a unique family of large, structural proteins that make up the bulk of spider silk fibres. The mechanical strength and elasticity of spider silk fibres have led to their successful use in the regeneration of peripheral nerves in rats [1], with the same properties giving the potential for use in a wide range of other applications [2,3,4]. The production of these proteins on an industrial scale, however, has only become possible fairly recently.
Spiber Technologies, based in Uppsala, Sweden, aim to commercialize recombinant spider proteins, adjusting their production method in order to provide customers with spidroins tailored to their needs. The evolution of spidroins has been highly influenced by a requirement for high tensile strength, a quality that does not necessarily guarantee stability when other stresses are applied. This application note describes the use of a Zetasizer Nano ZSP to characterize the stability at different temperatures of three different spidroins produced by Spiber Technologies.

|
The hydrodynamic size of the Spidroin samples was determined using a Zetasizer Nano ZSP. All DLS measurements were acquired in triplicate with a scattering detection angle of 173 °C using Malvern-patented NIBS (Non-Invasive Back-Scatter) technology. All measurements were acquired at 20 °C after allowing for thermal equilibration of samples.
Table 1 shows the results of the cumulants analysis on all three constructs at three concentrations. The cumulants analysis is used here as a simple screening procedure, the values generated allowing a quick assessment of construct quality. Table 1 demonstrates that, even before stability trials, Spidroin 2 forms large aggregates. With this construct being shown to be unstable, further analysis was not carried out on it, and the focus of the remainder of this study was on the other two constructs. In addition, Table 1 demonstrates that the measured Z-average diameter of the spidroins prior to storage increases with concentration, and that the Z-average diameter of pre-storage Spidroin 3 is greater than that of Spidroin 1at all concentrations tested. The former is consistent with the fact that the propensity of proteins to aggregate increases with concentration, whilst the latter suggests that Spidroin 3 is less stable than Spidroin 1. Both points are explored further below.
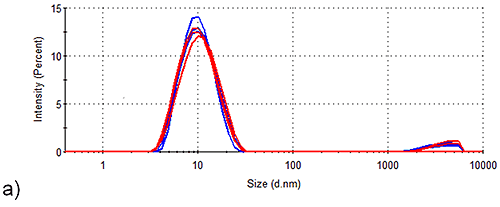
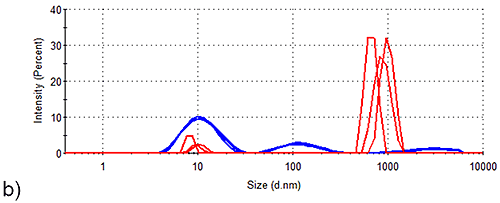
Figure 2 shows the intensity size distributions obtained for Spidroins 1 and 3 before and after being stored for 1 week. Whilst storage of Spidroin 1 under such conditions has no observable effect on the intensity distribution of the sample, Spidroin 3 clearly undergoes substantial aggregation. Conversion of the intensity distributions shown in Figure 1 to volume distributions allows analysis of the relative contribution of each particle-size to the total protein-occupied volume of the samples. Table 2 demonstrates that aggregates account for 5 % of the total protein-occupied volume of the post-storage Spidroin 3 sample. Prior to storage, only 0.1 % of the protein occupied volume of the Spidroin 3 sample was accounted for by aggregates. On the other hand, aggregates make no measurable volume-based contribution to the Spidroin 1 sample either before or after storage.
| Spidroin Construct | Concentration | Z-Average Diameter (nm) |
|---|---|---|
| Spidroin 1 | Conc. 1 | 9.7 ± 0.1 |
| 2 x (Conc. 1) | 10.8 ± 0.3 | |
| 6 x (Conc. 1) | 13.3 ± 0.6 | |
| Spidroin 2 | Conc. 1 | 42.0 ± 0.2 |
| 2 x (Conc. 1) | 47.3 ± 0.1 | |
| 6 x (Conc. 1) | 60.8 ± 0.9 | |
| Spidroin 3 | Conc. 1 | 14.6 ± 0.8 |
| 2 x (Conc. 1) | 13.9 ± 0.4 | |
| 6 x (Conc. 1) | 19.7 ± 0.6 |

|

|
| Sample | % Monomer | % Aggregate |
|---|---|---|
| Pre-storage Spidroin 1 | 100.0 ± 0.0 | 0.0 ± 0.0 |
| Post-storage Spidroin 1 | 100.0 ± 0.0 | 0.0 ± 0.0 |
| Pre-storage Spidroin 3 | 99.9 ± 0.0 | 0.1 ± 0.0 |
| Post-storage Spidroin 3 | 95.3 ± 3.0 | 4.7 ± 3.0 |
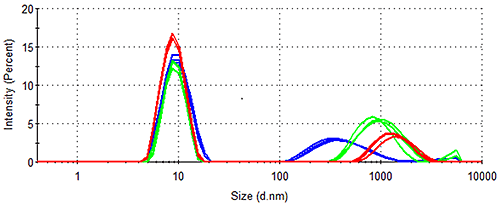
The data from both cumulants (Table 1) and distribution (Figure 2 and Table 2) analyses clearly demonstrate that Spidroin 1 is the most stable of the proteins analysed. In order to assess the stability of this sample further, samples were stored at a higher concentration at various temperatures for various time periods. Figure 3 shows the results obtained from analysis of Spidroin 1 at high concentration after storage at different temperatures. Figure 3 demonstrates that large aggregates are already present in the high concentration Spidroin 1 sample prior to storage. Further aggregation occurs during storage, with the aggregates detected in both post-storage samples being larger than those in the pre-storage sample (Figure 3). Table 3 shows the volume distribution data calculated from the intensity distributions in Figure 3. Table 3 demonstrates that the aggregates identified in the pre-storage sample are present only in trace amounts, having no measurable effect on the size distribution by volume. Table 3 also indicates that aggregation progresses during storage at both high and low temperatures to the extent that large aggregates occupy a significant proportion of the protein-occupied volumes of both post-storage samples.

|
| Sample | % < 30 nm | % Large Aggregate |
|---|---|---|
| Pre-storage | 100.0 ± 0.0 | 0.0 ± 0.0 |
| After 1 day at a relatively high temperature | 99.8 ± 0.1 | 0.2 ± 0.1 |
| After 1 week at a relatively low temperature | 99.9 ± 0.0 | 0.1 ± 0.0 |
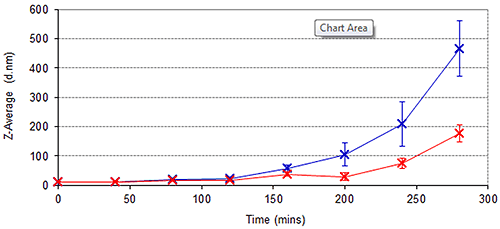
In addition to long term stability studies, the cuvette-based nature and high sensitivity of the Zetasizer Nano ZSP provides an ideal means of assessing the kinetics of protein aggregation processes over shorter periods of time. Figure 4 demonstrates the growth of Spidroin 1 aggregates over an 8 hour period, the sample being left in a cuvette in the Peltier Temperature controlled cell-chamber for the duration. Figure 4 demonstrates that the rate of Spidroin 1 aggregation increases with concentration. This is consistent with the data displayed in Table 1, and the widely noted dependence of protein aggregation on concentration.

|
Given the selection pressure on silk proteins to possess high tensile strength it is essential that their long-term stability in solution, something that may not have been as important to the success of these proteins during their evolution, is fully characterized. The various dynamic light scattering data analysis methods of the Zetasizer Nano ZSP have been applied to such a stability analysis of three different spidroin constructs. Simple cumulants screening analysis allowed one of the constructs (Spidroin 2) to be quickly classified as unstable and also gave an indication of the relative stability of the other 2 spidroins. Intensity and volume distribution analyses of Spidroins 1 and 3 before and after storage confirmed Spidroin 1 as the most stable construct. Despite the high stability of Spidroin 1, increasing the concentration of the construct and using different storage methods led to aggregation, with oligomers occupying < 0.3 % of the total protein-occupied volume being detected and accurately sized by the Zetasizer Nano ZSP. The effect of concentration on stability was investigated further by monitoring Spidroin 1 aggregation at different concentrations in the Zetasizer Peltier temperature controlled cell.
This application note demonstrates the usefulness of the Zetasizer Nano ZSP for storage and stability studies. The high sensitivity of the instrument to aggregate formation allows the detection, sizing, and calculation of the relative proportions, of trace amounts of aggregated protein.
Allmeling, C., Jokuszies, A., Reimers, K., Kall, S., Choi, C. Y., Brandes, G., Kasper, C., Scheper, T., Guggenheim, M. & Vogt, P. M. (2008) Spider silk fibres in artificial nerve constructs promote peripheral nerve regeneration. Cell Proliferation 41, 408-420
Hardy, J. G., Leal-Egaña, A., Scheibel, T. R. (2013) Engineered spider silk protein-based composites for drug delivery. Macromol. Biosci.13, 1431-1437
Rising, A., Widhe, M., Johansson, J., Hedhammar, M. (2011) Spider silk proteins: recent advances in recombinant production, structure-function relationships and biomedical applications. Cell. Mol. Life Sci. 68, 169-184