
What is the Mark-Houwink equation – and how do you use it for polymer characterization?

Understanding polymers’ molecular structure is critical for predicting their properties and fine-tuning their performance. The Mark-Houwink equation – sometimes known as the Mark-Houwink-Sakurada equation – is one of the most powerful tools polymer scientists can use to gain this understanding.
By relating intrinsic viscosity to molar mass, the Mark-Houwink equation unlocks insights into polymer architecture, and it is especially powerful when validated using size exclusion chromatography (SEC) combined with multi-angle light scattering (SEC-MALS) and viscometry.
With these precise insights, petrochemicals professionals can fine-tune their polymers’ properties and ensure they meet precise specifications and regulatory requirements.
In this blog, we’ll cover what the Mark-Houwink equation is and how SEC-MALS can supercharge its insights, alongside examples of Mark-Houwink plots in real applications. Whether you’re researching and developing new grades of plastics, analyzing polymers as they go through production, or overseeing quality control, here’s how the equation can help.
What is the Mark-Houwink equation?
The Mark-Houwink equation describes the empirical relationship between a polymer’s intrinsic viscosity (η) and its molecular weight (M):
[η] = K · Ma
It has four key components:
- [η]: Intrinsic viscosity. This is a measure of how much a polymer increases the viscosity of the liquid in which it is dissolved.
- M: Molecular weight. This is the total weight of a molecule – for polymers, it refers to the weight of the polymer chain, which indicates how many monomer units are linked together.
- K and a: These are constants that depend on the type of polymer at hand and the solvent you’re using.
The Mark-Houwink equation is useful because it can help you calculate the molecular weight of your solution based on its intrinsic viscosity; working in the other direction, it can help you predict how viscous a polymer solution will be based on its molecular weight. It can also give you an insight into structural information such as branching and chain stiffness.
What are K and a in the Mark-Houwink equation?
In the Mark-Houwink equation, K and a are constants that describe the relationship between your polymer’s intrinsic viscosity and its molecular weight, and the shape of your polymer in solution.
The K constant determines the relationship between intrinsic viscosity and molecular weight. It depends on:
- The type of polymer
- The solvent it’s dissolved in
- The temperature of the solution
Larger K values mean that even small polymer molecules noticeably increase the solution’s viscosity; smaller K values mean the polymer doesn’t affect the viscosity as much per unit of mass.
K values can vary widely and are usually listed in polymer data tables. If not, they must be measured experimentally. This is typically done by measuring intrinsic viscosity and molecular weight using an absolute method such as SEC-MALS and then fitting this data to the Mark-Houwink equation.
a tells you about the shape of your polymer in solution:
- If a is around 0, the polymer has a compact or sphere-like structure, for instance forming a tight coil.
- If a is between 0.5 and 0.8, the polymer is structured in random coils.
- If a is above 1, the polymer resists coiling and forms rigid, rod-like molecules.
What is the Mark-Houwink equation used for?
The Mark-Houwink equation is used to create Mark-Houwink plots, where log[η] is plotted against log(M). These plots enable scientists to:
- Compare polymer architectures
- Detect branching or structural changes
- Analyze consistency across molecular weights
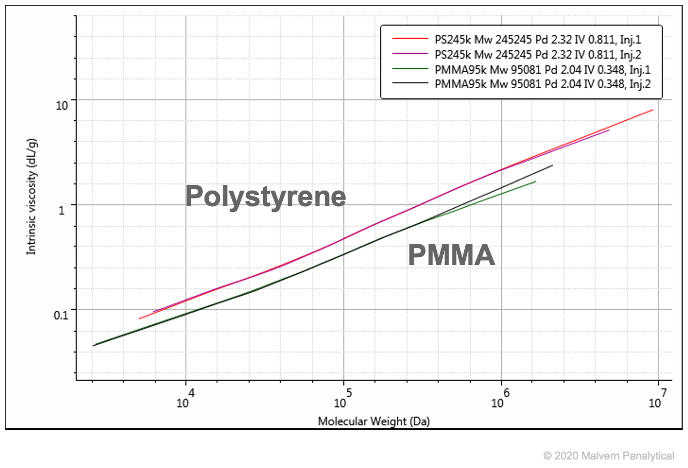
For example, here’s a comparison of Polystyrene and PMMA on a Mark-Houwink plot. As PMMA has a denser molecular structure, it appears lower on the plot:
You can see more examples of Mark-Houwink plots below.
How to calculate K and a values in the Mark-Houwink equation
If you don’t know the K and a values for your polymer and solution combination, or want to precisely validate or calibrate your method to your materials, you must measure them experimentally. This can be done with SEC, often combined with SEC-MALS.
With SEC-MALS instruments like Malvern Panalytical’s OMNISEC, plus a viscometer, you can see how intrinsic viscosity [η] and molecular weight (M) change across the entire molecular weight distribution of your sample, rather than just at an average point.
This is especially helpful when characterizing new polymers and streamlining your quality control methods for the future. Instead of repeating in-depth analysis during routine QC, you can quickly estimate the molecular weight of your sample based on the proven intrinsic viscosity values of your materials.
Examples of the Mark-Houwink equation in action: Insights from our analyses
To understand how the Mark-Houwink equation is used in practice, especially when combined with SEC-MALS technology, it’s best to look at real examples. Here are three examples of the Mark-Houwink equation being applied using our instruments.
1. Revealing polymer structure by combining APC and OMNISEC REVEAL
In this study, we combined Waters ACQUITY Advanced Polymer Chromatography (APC™) with our OMNISEC multi-detection instrument to compare polystyrene, polycarbonate, and polyvinyl chloride (PVC). We then input these materials’ molecular weight distributions into a Mark-Houwink plot to reveal that:
- Polystyrene had the lowest intrinsic viscosity, suggesting a compact, dense structure.
- Polycarbonate showed a higher intrinsic viscosity, meaning it has a more open, less dense structure.
- PVC did not follow a linear pattern at high molecular weights, suggesting that branching was occurring – a finding that would have been invisible without multi-detector SEC.

Read the full study here.
2. Comparing dextran samples to other polysaccharides
Dextran is a polysaccharide that is commonly applied in the medical field, for instance, in eye drop lubricants and intravenous solution components that help prevent blood clotting. In these medicinal applications, the molecular weight and intrinsic viscosity of each dextran sample dictate its behavior and potential side effects. It is therefore important to accurately characterize these materials before their use in pharmaceuticals.
We used our OMNISEC triple detection system to analyze the structural consistency of dextran samples with molecular weights ranging from around 1 kDa to over 650 kDa and compare them to two other biopolymers: gum Arabic and pectin. The Mark-Houwink plot showed that:
- The dextran samples exhibited structural consistency.
- Gum Arabic fell below the dextran line, meaning it is denser than dextran.
- Pectin sat above the dextran line, demonstrating its higher viscosity – a property that is to be expected from a gelling agent such as this.

Read the full application note here.
3. Modifying the backbone of bimodal polymers
Finally, we submitted a bimodal polymer to four phases of backbone modification and used the Mark-Houwink plot to discern the success of the modification. Our study found that:
- Initially, there were two distinct Mark-Houwink lines when comparing the starting material and final product, demonstrating the presence of two structural populations.
- After each modification step, the intrinsic viscosity increased, especially for the peak of the low molecular weight range.
- The final result was a single line in the Mark-Houwink plot, indicating a structurally consistent final product.

Read the full application note here.
Combine the Mark-Houwink equation with precise analysis for complete polymer characterization
For petrochemicals professionals across research and development, process management, and quality control, the Mark-Houwink equation is an invaluable tool for validating your analyses and streamlining your processes.
To supercharge your calculations, explore our OMNISEC range of solutions: the world’s most advanced multi-detector SEC system.
Further reads
- What is the Mark-Houwink equation – and how do you use it for polymer characterization?
- Optimizing XRD throughput with the Aeris High-Capacity Sample Changer: Key insights from our webinar
- How to test for microplastics in water
- Why Aeris is a gamechanger for quality control
- A guide to the crystallinity of polymers