Label free protein ligand interaction analysis solutions using GCI and ITC
Understanding binding affinity is key to appreciating the intermolecular interactions driving biological processes, structural biology, and structure-function relationships. Binding affinity is also measured as part of the drug discovery process to help design drugs that bind their targets selectively and specifically.
Binding affinity is the strength of the binding interaction between a single biomolecule (e.g., a protein or DNA) to its ligand or binding partner (e.g., a drug or inhibitor). Binding affinity is typically measured and reported by the equilibrium dissociation constant (KD), which is used to evaluate and rank order strengths of bimolecular interactions. The smaller the KD value, the greater the binding affinity of the ligand for its target. The larger the KD value, the more weakly the target molecule and ligand are attracted to and bind to one another.
Binding affinity is influenced by non-covalent intermolecular interactions such as hydrogen bonding, electrostatic interactions, and hydrophobic and van der Waals forces between the two molecules. In addition, binding affinity between a ligand and its target molecule may be affected by the presence of other molecules.
Whenever you are characterizing proteins, nucleic acids, compounds or any biomolecule, understanding their binding affinity to substrates, inhibitors, and cofactors is key to appreciating their intermolecular interactions. This understanding is relevant when studying interactions such as enzymatic reactions, protein complexes, or receptor binding.
For drug discovery, binding affinity helps design drugs that bind their targets selectively and specifically.
There are many ways to measure binding affinity, including methods that require the interactors to be labeled and label-free approaches. The main labeled, qualitative method (i.e., binding: yes/no) is enzyme-linked immunosorbent assay (ELISA). Key label-free, quantitative methods include spectroscopic assays, isothermal titration calorimetry (ITC), or optical biosensors such as surface plasmon resonance (SPR), biolayer interferometry (BLI), and grating-coupled interferometry (GCI).
However you measure binding affinity, the measurement will result in multiple report points, from which a binding affinity curve can be created. This curve depends on both the concentration of the sample and the interaction between sample and target.
This makes it important to know the concentration of your sample and consider the right incubation period, in addition to your regular, proper experimental controls. It’s particularly important to reach equilibrium (where the amount of molecules binding to the target is the same as the amount disassociating from the target) during your assay. Without reaching equilibrium you cannot reliably determine affinity, as the binding model cannot be reliably fitted.
Find out more in our Kinetics Guide.
Malvern Panalytical offers both Grating Coupled Interferometry (GCI) and Isothermal Titration Calorimetry (ITC). Both are label-free quantification techniques, allowing the use of native molecules. Highly quantitative affinity (KD values) can be derived from both for a broad range of interactions.
GCI is an optical method that can provide real-time measurements of kinetics as well as affinity. It measures the change in refractive index in an evanescent field caused by the binding event. GCI measures KD values in the millimolar to picomolar range. In addition, it can determine the kinetics of an interaction – more specifically, the on- and off-rates (ka and kd).
ITC measures the heat change associated with the binding event, measures KD values in the millimolar-to-nanomolar range and determines the binding stoichiometry and binding thermodynamics of the interaction. Both kinetics and thermodynamics are important in the characterization of intermolecular interactions.


The affinity from both devices is orthogonal and taken together can provide confidence when a highly quantitative KD is required – for instance, in lead optimization applications.
GCI benefits from higher sensitivity, higher throughput, and lower sample consumption, and performs well with crude samples. If these factors and the kinetic information are the most important to your application, then this is the instrument of choice.
If thermodynamic data (enthalpy and entropy) and stoichiometry are most important, then ITC is the best solution. ITC also benefits from minimal assay development, so can generate results more quickly if only a small number of measurements of a given interaction pair are anticipated. The technique is also non-destructive, and the sample can be recovered post-experiment.
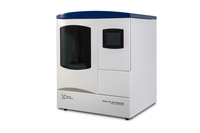
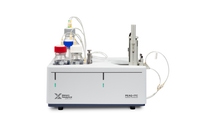
The WAVEsystem (GCI) and MicroCal PEAQ-ITC (ITC) are both designed with the user in mind and are known for being easy to use in their respective instrument classes.

WAVEsystemNext-generation bioanalytical instruments for drug discovery and life sciences for both industry and academic research |

MicroCal PEAQ-ITC AutomatedFully automated, hands free ITC for increased productivity |

MicroCal PEAQ-ITCThe Gold Standard for measuring affinity and stoichiometry |
|
|---|---|---|---|
| Technology | |||
| Isothermal Titration Calorimetry (ITC) | |||
| Grating-coupled interferometry (GCI) | |||
| Sample throughput | WAVE: 58 / WAVEdelta 500per 24h day | Up to - 42per 24h day | Up to - 12per 8h day |
| Temperature range | WAVE: 15-40°C / WAVEdelta: 4-45°C | 2°C - 80°C | 2°C - 80°C |