Bacteria fibers are typically monitored with manual microscopy to better understand the effect of environmental factors on their growth. Here, bacteria fibers taken at different times are automatically characterised on the Morphologi G3. Fiber parameters are measured and used to quantitatively differentiate between samples taken at different times. The Morphologi G3 offers significant time savings and decreased subjectivity over the traditional manual optical microscopy method.
Trichodesmium is a globally significant genus of filamentous cyanobacteria (blue-green algae) that inhabits warm waters in the tropical oceans. Ecologists and biologists are interested in researching the morphological growth of this organism to better understand how it acquires and uses nutrients such as phosphorus and micronutrient iron, which are often in short supply.
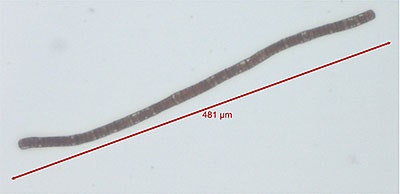
It is important for scientists to monitor these changes so they can predict how eco-systems will be affected by the impact of our ever-growing global population. Trichodesmium bacteria are approximately 10 microns wide and can be several millimeters long, an example bacteria strand is shown in Figure 1. The elongated and fibrous nature of the bacteria means they are not well suited to conventional phytoplankton counting instruments.
|
Instead the growth of this bacterium is typically monitored by filtering samples and counting up to 50 individual bacteria filaments on a manual microscope followed by analysis on third party software. The process is subjective, error prone, tedious and time consuming; a complete analysis on a single sample can take up to 3 hours. As a result, time resolved, or nutrient dependent analyses of around 18 samples can take up to 2 weeks.
Here, we present completely automated 30 minute analysis of suspended bacteria on the Morphologi G3 with the wet cell accessory. The Morphologi G3 is normally used for particle characterization but here, we show how this versatile instrument can also quickly and easily characterize filamentous bacteria strands with over 20 morphological parameters; specifically we demonstrate the use of fiber parameters.
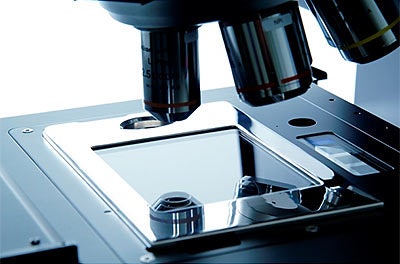
Samples of suspended Trichodesmium bacterium are prepared for analysis on the Morphologi G3, without any prior treatment by simply injecting ~2.5 ml of the suspension into the wet cell accessory (Figure 2).
|
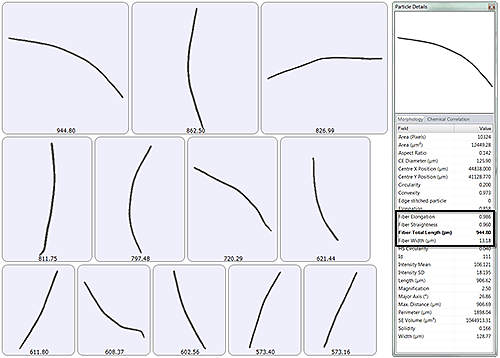
The Morphologi records a range of size and shape parameters, including four specific parameters that are especially useful for characterizing Trichodesmium bacteria; fiber total length, fiber width, fiber elongation and fiber straightness2.
After collecting morphological data, the manual microscope mode can be used to go back to specific filaments of interest and capture full color images for closer scrutiny (an example is shown in Figure 1). The automated nature of the Morphologi instrument means that while an analysis is running the operator is free to perform other important tasks such as interpreting the high volumes of data obtained. With this method, changes in bacterial growth can be observed on a daily basis, offering a significant improvement in resolution for time based studies.
During a Morphologi G3 measurement, an image of every filament is recorded. Figure 3 presents images of the longest bacteria measured during an example measurement. All recorded properties are also shown; fiber specific parameters are highlighted in the box.
|
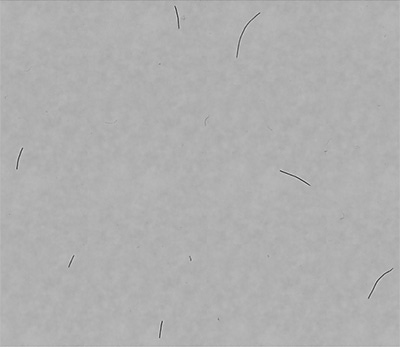
For a quick overview, the composite image comprising all bacteria captured during analysis can be viewed to assess the distribution of filaments and ensure they are not overlapping. Figure 4 shows a portion of this composite image.
|
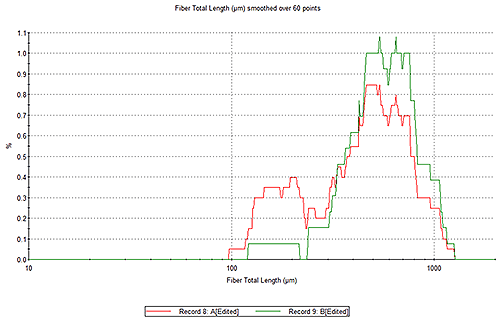
Frequency histograms are useful for a visual indication of bacteria size or shape distributions. Figure 5 shows the evolution of fiber total length for two suspensions of bacteria taken at different times; the sample extracted earlier (red) exhibits shorter filaments than that which was extracted later (green). Comparing distributions from samples of the culture taken at different times can reveal changes in morphology with time. Here, filaments appear to grow longer with time.
|
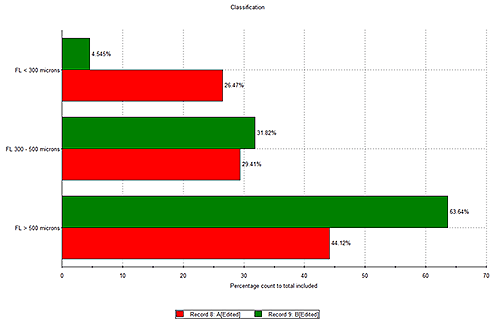
By classifying bacterial filaments into groups with different fiber total length, and comparing samples as a function of time, nutrient supply, or temperature, a classification chart can be used to quantitatively show differences across different samples. Figure 6 compares two samples A and B. Sample B contains a higher percentage count of filaments with total fiber length > 500 µm while sample A has a greater proportion of filaments with total fiber length < 300 µm, which may indicate these bacteria are growing.
|
Trichodesmium bacteria are characterized on the Morphologi G3 with excellent time savings compared to traditional manual microscopy techniques. Time resolved, or nutrient dependent analyses performed on the Morphologi G3 can be performed on up to 18 samples in just one day enabling scientists to follow changes or growth patterns much more efficiently. Statistically meaningful numbers of bacteria filaments can be automatically collected and characterized, freeing up valuable operator time for in depth analysis and comparison of bacterial cultures. Here, Trichodesmium bacteria have been specifically studied with the fiber mode on the Morphologi G3, however the fiber mode could also be applied to other fibrous materials such as textiles, paper pulp, viruses, or elongated biological specimens.
[1] Application data kindly provided by Professor Andrew Rose, School of Environment, Science and Engineering, Lismore Campus, Southern Cross University, Australia.
[2] “Fibre parameter measurements using the Morphologi G3 particle characterisation system,” [Online].