This Technical Note gives an overview of the experimental methodology and principles behind relative viscosity measurements on the Viscosizer TD, and presents measurement data from a certified viscosity standard.
The Malvern Viscosizer TD is an automated biophysical characterization tool utilizing Taylor Dispersion Analysis and UV detection1 to provide ultra-low volume, solution-based molecular size and stability measurement capabilities, combined with Poiseuille flow in a microcapillary for relative viscosity assessment.
Relative viscosity measurement capabilities in Viscosizer TD are highly complementary to Taylor Dispersion measurements, in that diffusion coefficient measurements can be viscosity-corrected for the determination of hydrodynamic size.
The relative viscosity measurement technique is essentially a fully automated microcapillary analogue of the traditional glass or U-tube capillary viscometer, such as Ostwald or Ubbelohde types. Sample volumes using a microcapillary are reduced to typically 6μl per run. Viscosizer TD also utilizes high precision pressure control and automated timing detection at twin windows to provide high resolution and highly reproducible measurements in the low viscosity regime – which also makes the technique ideal for viscosity screening at Candidate Validation and Early Formulation Development stages of the biopharmaceutical pipeline2,3. Sample availability at these very early stages is critically limited, and concentrating solutions up to full formulation levels is not possible, so the ability to identify abnormal viscosity profiles from low concentration measurements is advantageous.
This Technical Note gives an overview of the experimental methodology and principles behind relative viscosity measurements on the Viscosizer TD, and presents measurement data from a certified viscosity standard.
The Viscosizer TD instrument comprises three main components (see Figure 1):
Using the same microcapillary set up, two experimental methodologies are used to determine either the hydrodynamic size of molecules in solution, or the relative viscosity of the solution.
Automated size and viscosity analyses can be run on the same sample, including replicate measurements
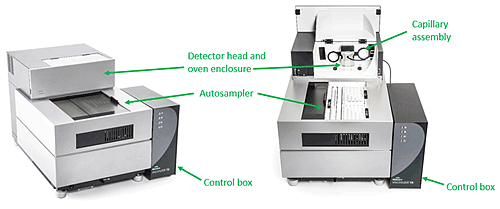
Figure 1: Viscosizer TD system components
Poiseuille’s law relates the volumetric flow rate of an incompressible Newtonian fluid through a cylindrical pipe of constant cross section for a given applied pressure:

Equation 1, where:
Q=Volumetric flow rate [m3∙s-1]
ΔP=Pressure drop [Pa]
r=Capillary radius [m]
η=Dynamic viscosity [Pa∙s]
L=Capillary length [m]
Poiseuille’s law assumes that the flow type is laminar (Reynolds number Re < 2100), where circular layers (lamina) of fluid have a velocity determined by their radial distance from the center of the pipe. This creates a characteristic velocity profile (see Figure 2), with liquid in the center of the pipe travelling fastest and liquid touching the walls of the pipe remaining stationary (due to the no-slip condition)4.
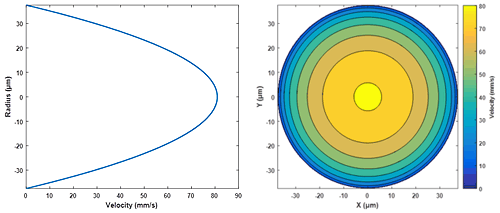
Figure 2: Velocity profile of water in a cylindrical capillary (ΔP = 3000mbar; r = 37.5µm; η = 1.0021cP; L = 1.3m)
Viscosizer TD utilizes the predictable behavior of ideal fluid flow through fused silica microcapillary tubes to measure the viscosity of Newtonian solutions.
Taylor Dispersion measurements are carried out by injecting a sample pulse into the capillary containing a run buffer, and using UV detection to measure the absorbance at two windows a fixed distance apart. Hence the sample/buffer interfaces are detected, and this also enables relative viscosity measurements by timing a sample plug between the two windows under constant drive pressure. Samples which do not absorb in UV but have a different refractive index to the run buffer can also be detected due to an apparent absorbance shift caused by refraction. This allows an extension of the method with the use of air as a run buffer, rather than a liquid.
The use of air as a run buffer has detection advantages in that refractive index differences are maximized and the measured sample/buffer interface is typically very sharp (unlike with a liquid run buffer, where complex interfaces can arise due to Taylor Dispersion). Such a sharp feature can then be easily used to determine the time at which the sample passes the detection window. The time taken for a sample plug to pass from one window to the other is used to calculate the viscosity.
To reduce error in the measurement, the Viscosizer TD uses a relative measurement technique. The time taken for a sample of known viscosity (commonly water) to traverse the windows is then used to calculate the viscosity of a sample of unknown viscosity.
Uncertainty in the geometry factors (e.g. capillary radius) and experimental parameters (e.g. applied pressure) are significantly reduced by this relative methodology, allowing high accuracy results.
Equation 2 is the general formula for calculating viscosity, where the sample, reference and buffer viscosity are all different from one another:
Equation 2, where:
ηs=Sample viscosity [Pa∙s]
ηr=Reference viscosity [Pa∙s]
ηb=Buffer viscosity [Pa∙s]
L=Capillary length [m]
lx=Length to window x [m]
Δts=Time for sample to traverse between windows [s]
Δtr=Time for reference to traverse between windows [s]
Assuming capillary symmetry, this can be simplified down to the much more manageable Equation 3:

Equation 3
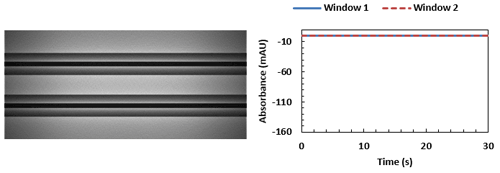
The capillary is initially filled with air at the beginning of a measurement. Air appears black in images due to the refracted path light travels at the glass-air interface.
Sample injection begins and some of the baseline is recorded and shown at the start of the trace.
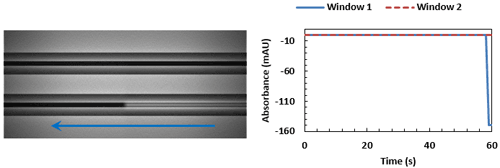
Window 1 (bottom capillary) begins to fill with sample (right to left). This is commonly referred to as the leading edge of the trace.
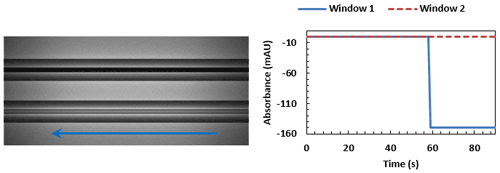
With window 1 fully occluded, a plateau in the trace can be seen. The leading edge of the sample is now traversing the loop before reaching window 2.
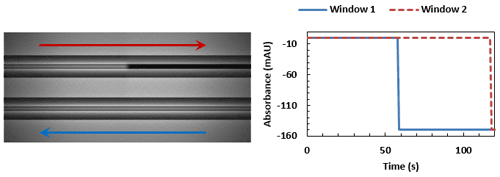
Sample reaches window 2, flowing from left to right.
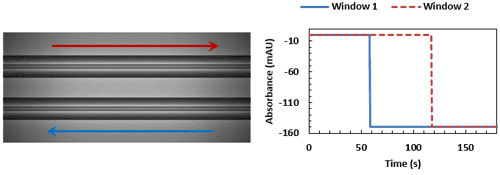
With both windows now fully occluded, the system switches back to air to push the sample back out to create a trailing edge in the same manner.
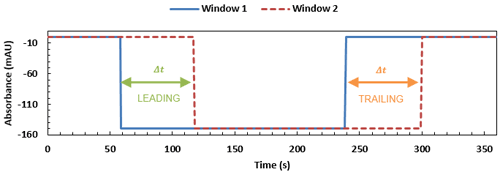
A fully completed viscosity trace, with the time differences between the leading and trailing edges of window 1 and 2 shown. These timings can then be used in Equation 2 for measurements of the sample (∆ts) and of a reference of known viscosity (∆tr), to determine the sample viscosity.
MGVS100 (Paragon Scientific Limited) is a medical viscosity standard with a nominal dynamic viscosity of 10.01 cP at 25.00°C.
Figure 3 shows a typical trace produced from a viscosity measurement of MGVS100 using air-driven protocols – it is noticeably square in profile, with a very high signal to noise ratio.
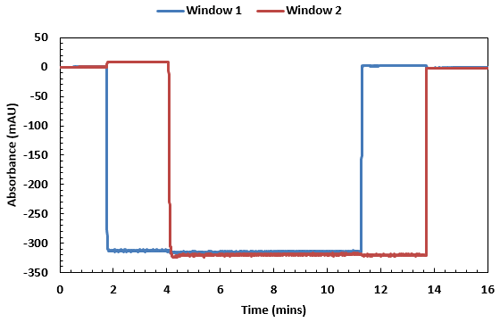
Figure 3: MGVS100 (medical viscosity standard) in air trace measured by the Viscosizer TD
A comparison between the certified values and those obtained from the Viscosizer TD is shown in Table 1.
| Temp (°C) | Nominal Value (cP) | Measured Value (cP) | Mean (cP) | Standard Deviation (cP) | Relative Standard Deviation (%) | Percentage Error (%) |
|---|---|---|---|---|---|---|
25 | 10.01 | 9.859 | 9.874 | 0.010 | 0.096 | 1.4 |
9.869 | ||||||
9.876 | ||||||
9.883 | ||||||
9.880 | ||||||
37 | 6.341 | 6.451 | 6.457 | 0.004 | 0.066 | 1.8 |
6.460 | ||||||
6.454 | ||||||
6.460 | ||||||
6.460 |
Table 1: Comparison between certified (nominal) viscosity values and measured viscosity data from the Viscosizer TD for MGVS100 at 25°C and at 37°C
Air-driven relative viscosity methodology is the recommended and default setting for Viscosizer TD as this has some clear advantages over the use of a liquid buffer: