|
|
Transferring methods between different laser diffraction particle size instrumentation requires consideration of the following three method variables;
When all of the above are transferred correctly, and the particle size is within the range of both instruments, then excellent agreement can be achieved. Differences are expected when the particle size is towards the extremes of the size range due to the improved performance of newer instruments.
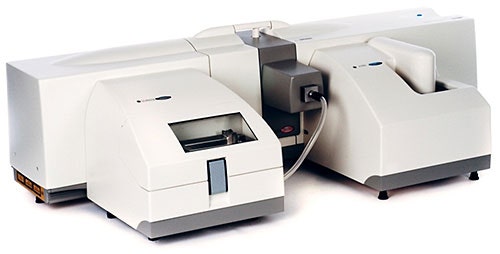
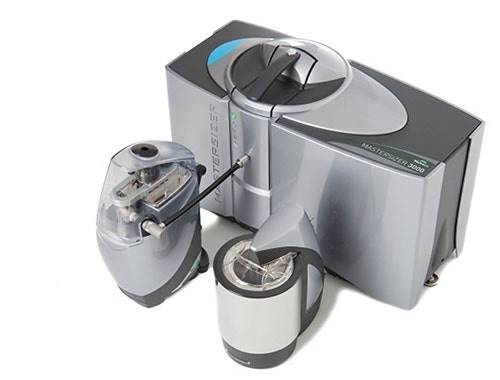
The aim of this note is to compare the calculation, measurement and dispersion settings of the Mastersizer 2000 and Mastersizer 3000 systems. Where parameters are not directly transferrable, tests will be suggested to determine the appropriate settings to achieve comparable results.
The ease of method transfer between two systems can depend on the robustness of the initial method. More detailed descriptions of method development and validation are provided in separate application notes [1, 2, 3].
Laser diffraction instruments use an optical model to interpret the measured scattering data and calculate a particle size distribution.
The most comprehensive optical model is Mie theory, which requires the user to input the optical properties of the sample (refractive index and absorption) and the dispersant, (refractive index).
Both the Mastersizer 2000 and Mastersizer 3000 use the exact values of refractive index and absorption (imaginary refractive index) which can be selected from a database, to which new materials can also be added. As such there is no change in the way optical properties are defined between the Mastersizer 2000 and Mastersizer 3000.
However, for accurate method transfer it is important to make sure that the optical properties are correct. If incorrect optical properties are used then, due to the difference in detector designs, the results obtained on each system may be different.
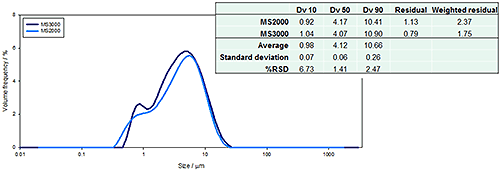
Figure 3 shows the results of a measurement of a calcium carbonate sample on the Mastersizer 2000 and Mastersizer 3000 using the default (incorrect) optical properties from the Mastersizer 2000 (refractive index=1.52, and absorption = 0.1). The results show a difference in the shape of the fine end of the distribution and significant variation in the value of the Dv10.
|
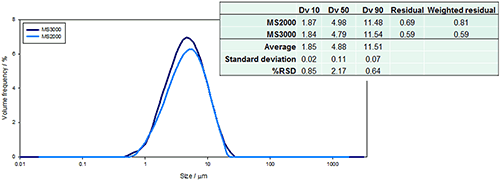
However, if the correct optical properties are used then excellent agreement between the two systems can be achieved. Figure 4 shows the results of the same calcium carbonate sample measured on both instruments and analyzed using a refractive index of 1.6 and absorption of 0.01. This shows much closer agreement between the two size distributions, and the percentiles measured on both instruments are within the ISO limits for repeatability [4].
The figures also show the analysis residuals (lower values indicate a better fit to the data) for each set of optical properties. Using 1.6 and 0.01 reduces the reported residuals on both instruments. This indicates that the fit between the measured and calculated scattering data has been improved and that these optical properties are more appropriate for the sample.
This example shows that good agreement can be achieved when appropriate optical properties are used; however it is important to note that incorrect optical properties may not give the same results on both systems.
|
In addition to the optical models used to interpret the scattering data, diffraction instruments use analysis models to better interpret data from distributions of different widths. For example, a general purpose model is suitable for most milled, precipitated and emulsion samples. However, a model for narrow modes may be more appropriate for classified or standard materials.
Table 1 shows a comparison chart for the analysis models available on Mastersizer 2000 and Mastersizer 3000. Although the names may have changed, most analysis models can be directly transferred between Mastersizer 2000 and Mastersizer 3000.
Sample type | Model type | |
|---|---|---|
Mastersizer 2000 | Mastersizer 3000 | |
Most materials | General purpose | General purpose |
Single mode, narrow sample | Single narrow mode | Narrow modes
|
Multiple mode narrow sample | Multiple narrow modes | Narrow modes |
Latex spheres | Single/multiple narrow modes | Verification latex |
Particle shape | Spherical or irregular | Spherical or irregular |
Dry fine powders | Fine powder mode | Fine powder mode |
In order to ensure that equivalent data can be recorded on both systems, comparable measurement parameters should be set and where there is no direct comparison the effect of these parameters on the results should be considered.
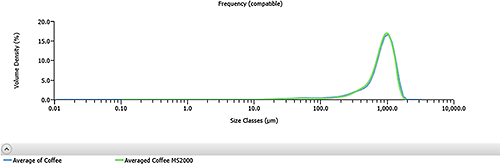
One potential source of differences in results may occur when samples are at the extremes of the instruments dynamic range, due to improvements in the dynamic range of the Mastersizer 3000 [6]. Figure 5 shows the results of a coffee sample measured on both instruments, where excellent agreement between the systems has been achieved. This is also a sample which uses the narrow modes model to improve the fit to the data.
|
Samples containing particles greater than 2000μm will show larger results on the Mastersizer 3000 and may show a cut off on the Mastersizer 2000 results. In these cases the result comparability may be improved by restricting the size range of the analysis used in the Mastersizer 3000.
The appropriate obscuration (related to concentration) range for a laser diffraction measurement is a balance between recording sufficient scattering data and avoiding multiple scattering.
If the amount of sample added to the dispersion unit is too low then the results will not be reproducible due a low signal to noise ratio. The reproducibility of the measurement can be tested by measuring separate sub samples of the materials.
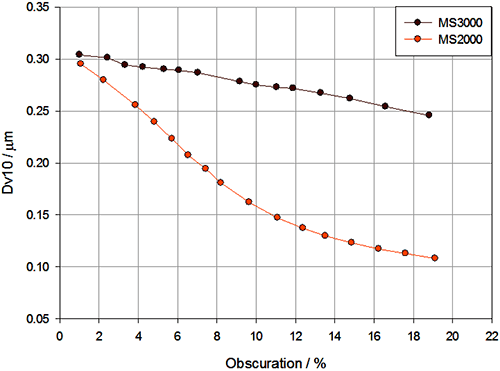
If the obscuration is too high then the measurement becomes affected by multiple scattering, causing a reduction in the measured particle size at higher obscurations. Due to improvements in the optical design the Mastersizer 3000 is less susceptible to multiple scattering. Therefore it is important to carry out an obscuration titration, particularly if the sample is smaller than 1μm, in order to determine over what obscuration range the particle size is stable.
Figure 6 shows two obscuration titrations carried out on the same emulsion sample on both instruments; where the Dv10 (as this is most sensitive to changes in fine particles) has been plotted against the obscuration. This shows that the Dv10 measured on the Mastersizer 2000 starts to decrease above 1% obscuration, whereas the decrease in size with increasing obscuration is much more gradual on the Mastersizer 3000.
As multiple scattering is dependent on particle size, different obscuration ranges are recommended for different particle sizes, as shown in Table 2.
| Sample | Obscuration | |
|---|---|---|
Mastersizer 2000 | Mastersizer 3000 | |
Wet (>20μm) | 5 - 25% | 5 - 25% |
Wet (1-20μm) | 1 - 10% | 1 - 13 % |
Wet (<1μm) | 1 - 5% | 1 - 8 % |
Dry | 0.5 - 6 % | 0.5 - 8% |
Obscuration levels for dry measurements are specified in order to optimize the dispersion efficiency of the venturi, for example fine cohesive samples may be measured over a lower obscuration range. Due to changes in the disperser geometries the Aero dispersion unit can work over slightly wider obscuration ranges than the Scirocco.
|
The duration of a laser diffraction measurement affects sampling of the material added to the dispersion unit.
If the measurement duration is too short, there may be insufficient time for all particles to circulate through the measurement cell. If a small number of coarse particles are missed from a polydisperse sample then this may cause a significant change in the results.
The duration of a diffraction measurement is set in seconds, the Mastersizer 2000 shows the duration in both seconds and detector scans. The number of detector scans per second depends on the data acquisition rate of the instrument; this is 1 kHz for the Mastersizer 2000 and 10 kHz for the Mastersizer 3000.
Even though the data acquisition rate has increased, it is recommended that the measurement duration is kept the same. The increase in the data acquisition rate will further improve sampling of the material. The greatest benefit from this increased data acquisition rate may be seen in dry measurements, due to increased sensitivity to particle sizes present in small quantities.
Achieving the same state of dispersion on both systems is key to obtaining comparable results on both instruments.
A range of wet dispersion units with different volumes are available with both instruments. To ease method transfer, choose the corresponding dispersion unit with the closest volume.
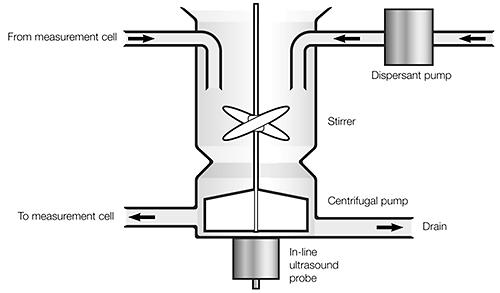
The stir speed can affect the suspension of coarse or dense particles, or breakage of fragile particles. The Hydro MV and Hydro LV share similar tank designs, with an integrated centrifugal pump and stirrer.
Due to similarities between dispersion units such as the Hydro S and Hydro MV, and Hydro MU and Hydro EV, in the majority of cases the stir speed should be directly transferrable. However, as the Hydro G uses a separate pump and stir compared to the integrated pump stir of the Hydro LV, it is recommended that a stir speed titration is carried out in order to ensure that equivalent results are obtained.
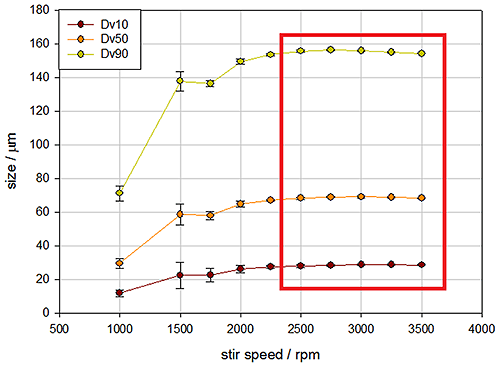
For large or dense materials a stir speed titration will determine the speed at which all of the material has been suspended. Figure 8 shows a stir speed titration on the Hydro LV for a dense copper powder, where all of the material is suspended above 2500rpm .
|
|
The Hydro SM dispersion unit is used on both the Mastersizer 2000 and Mastersizer 3000, therefore the dispersion unit parameters will be directly transferrable for the vast majority of materials. However, as the flow path has changed it may be necessary to test the effect of stir speed for some samples, particularly plate like particles.
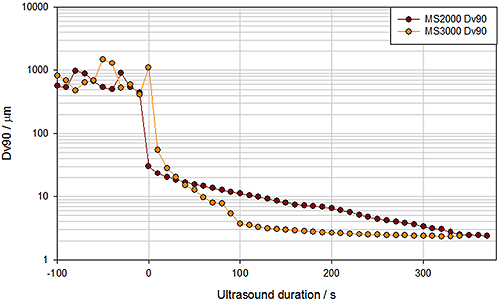
Wet dispersion units use ultrasound to disperse agglomerates, the Mastersizer 3000 dispersion units use in line sonication to increase dispersion efficiency. In the Hydro MV and LV the ultrasound transducer forms part of the pump chamber, whereas the EV uses a separate ultrasound chamber. In both designs the particles must pass close to the ultrasound transducer, improving the dispersion efficiency.
Therefore, using the new dispersion units may reduce the ultrasound duration required to disperse a sample. Figure 9 shows a dispersion trend for an agglomerated sample on a Mastersizer 2000 dispersion unit compared with the new Mastersizer 3000 dispersion unit. This shows that it takes over 300 seconds to disperse the sample using the Mastersizer 2000 dispersion unit, whereas a stable particle size is reached in half the time using the new dispersion unit.
|
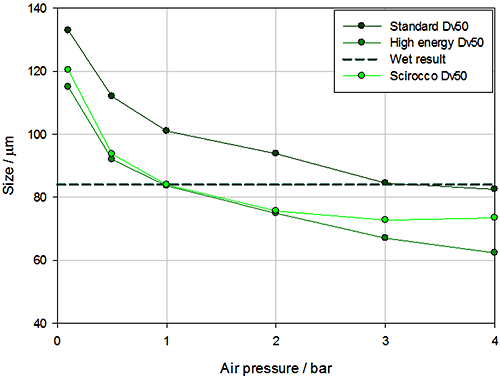
In dry measurements, dispersion is achieved using compressed air and varying the air pressure allows the level of dispersion to be controlled.

|
|
In moving from Scirocco to Aero the dry powder disperser has been completely redesigned. The Aero uses a modular disperser design to enable different dispersion mechanisms to be used for fragile, cohesive or robust samples (a more detailed description of the Aero disperser is available in a separate technical note [6]).
Due to this change in dispersion mechanisms, it is recommended that a pressure titration should be carried out in order to determine which disperser and what pressure is appropriate for the sample. Figure 11 shows pressure titrations (Dv50 vs. pressure) measured for a milk powder using both the Scirocco and the standard and high energy venturi units with the Aero. The dispersed wet result has also been added to the graph to evaluate the corresponding pressure at which the sample has been correctly dispersed.
The results show that the sample is dispersed at 1bar using the Scirocco and the high energy Aero venturi, and at between 3bar and 4bar using the standard Aero venturi. Therefore, the standard Aero venturi would be recommended for this sample as it shows that the sample is dispersed in a region where the result is stable with pressure (between 3 and 4 bar).
The flowing section contains three method transfer case studies, where each example illustrates some of the principles described in this application note.
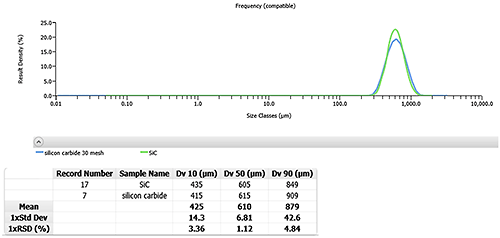
The first example is a Silicon carbide sample with a large particle size, the Dv50 is approximately 600μm. Due to the large particle size, when measured in wet dispersion the important parameters for transferring this method are adequate sampling of the material and ensuring that all of the particles in the dispersion unit are suspended.
This sample was measured using the large volume dispersion units, Hydro G and Hydro LV, which allow a larger volume of sample to be measured which improves sampling. For this sample it was also important to carry out a stir speed titration on the Hydro LV to ensure that all particles were suspended. As the particles are large, a stir speed of 3500rpm was determined to be sufficient to suspend all of the particles in the sample.
Considering these two important factors in transferring the method has resulted in comparable size distributions and percentiles which are within the ISO limits for repeatability, as shown in Figure 12.
|
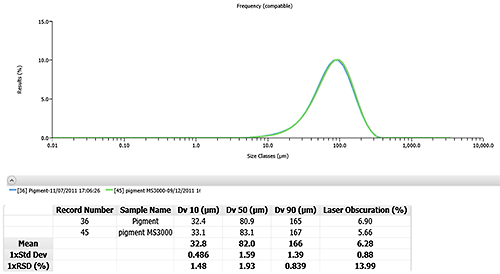
The second example is a mineral pigment, with particles in the size range of tens to hundreds of microns. As the sample contains particles smaller than 50μm, the important factors to consider are the optical properties and state of dispersion.
In this example the sample has been measured wet using the Hydro S and Hydro MV dispersion units. The sample dispersed well in water and ultrasound was not required to provide any further dispersion.
As the sample is neither very large nor dense, then the stir speed is unlikely to affect the results. In this case the sample has been measured at a stir speed of 2000 rpm on both systems.
The refractive index of this material is given in the reference material as 1.68, and an absorption of 0.1 is appropriate for a colored material. These optical properties produced a good fit to the data, with residuals well below 1% .The results from the Mastersizer 2000 and Mastersizer 3000 are shown in Figure 13 where excellent agreement between the two particle size distributions was achieved and the differences between the calculated percentiles are well within the ISO limits for repeatability.
|
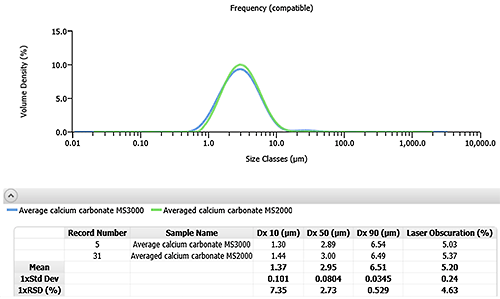
The final case study is a calcium carbonate sample with a size range between 1μm and 10μm. Due to the small size of this sample, the important factors to consider with this sample will be dispersion and optical properties.
This sample has been measured on the Hydro MU and Hydro EV. Calcium carbonates often require chemical stabilization, such as sodium phyrophosphate, as well as a short duration of ultrasound to disperse any agglomerates. In this case 1 minute of ultrasound at full power has been used on both systems. In both cases the stir speed has been set to 2000rpm.
|
The refractive index for calcium carbonate is in the region of 1.5 to 1.7. In this case a refractive index of 1.6 and an absorption of 0.01, appropriate to a crystalline milled material, have been used. Figure 14 shows the results of the calcium carbonate samples on the Mastersizer 2000 and Mastersizer 3000, this shows good agreement between the particle size distributions and the calculated percentiles.
Method transfer between diffraction instruments requires consideration of the analysis parameters, measurement parameters and the sample's state of dispersion.
This application note has discussed the transfer of these parameters between the Mastersizer 2000 and Mastersizer 3000, and suggested tests which can be carried out to ensure that results are comparable when parameters cannot be directly transferred.
Following such a method transfer process enables excellent agreement between Mastersizer 2000 and Mastersizer 3000 results to be achieved.
[1] Wet method development for laser diffraction measurements, MRK561-01
[2] Developing a method for dry powder analysis, MRK524-02
[3] Method validation for laser diffraction measurements, MRK671-01
[4] ISO13320 (2009). Particle Size Analysis - Laser Diffraction Methods, Part 1: General Principles
[5] Extending the boundaries of laser diffraction: Increased dynamic range and sensitivity with the Mastersizer 3000, MRK1821-01
[6] Extending the boundaries of laser diffraction: Enhanced dry powder dispersion with the Aero S, MRK1829-01