Dry powder inhalers are accepted as being complex drug products due to the interactions which occur between the active pharmaceutical ingredients (APIs) and excipients within the formulation and the way this then affects the efficiency of drug delivery by the inhaler device. Obtaining component specific particle size and particle shape distribution data can help with understanding the properties of the formulation as part of formulation or deformulation studies. This application note describes how the combination of automated image analysis with Raman spectroscopy in the Morphologi G3-ID allows the individual components present within a dry powder inhaler formulations to be independently characterized and compared.
Within the pharmaceutical industry there has been a drive in recent years for better product understanding through increased product knowledge. Towards this end, the ability to measure the particle size of the active pharmaceutical ingredient(s) (API) in product blends and formulations has provided valuable insights into product efficacy, which has the potential for translation into cost savings. The particle size distribution (PSD) is a particularly important characteristic in the development and manufacture of oral and nasal inhaled drug products (ONIDPs), as it is the main determinant of whether the API particles will reach their intended destination and function as required. The most common method for performing this analysis uses manual microscopy and visual identification of the API particles within a blend dispersion. These analyses can be time consuming, subjective and inaccurate. This application note describes how the combination of automated image analysis with Raman spectroscopy in the Morphologi G3-ID can be applied to increase both the accuracy and robustness of these types of measurements by chemically identifying and isolating the particles of interest within a dry powder inhaler (DPI) formulation.
A commercially available DPI sample comprised of two APIs was dry dispersed using the Morphologi G3's integrated sample dispersion unit (SDU) at high pressure onto an aluminum coated microscope slide. The particle size and shape were measured by automated image analysis, according to a standard operating procedure. For this analysis, the size range of interest was between 1 and 10 μm. All particles in that size range were grouped together in a "class", and subsequently targeted for Raman spectral analysis to determine their chemical identity. A spectral reference library was created by taking Raman point spectra of the pure components. The library and particle spectra were preprocessed to minimize baseline variation and normalized to minimize differences in peak intensities. The chemical identity of a particle is then determined by correlating its spectrum against the library spectra. The more similar a particle spectrum is to a library component, the closer its correlation score is to 1. The particles were classified based on their designated chemical identity and the particle size distribution (PSD) determined on the resulting population.
The automated image results alone could not be used to differentiate between the two APIs in the formulation. The particles were similar in shape, statistically speaking.
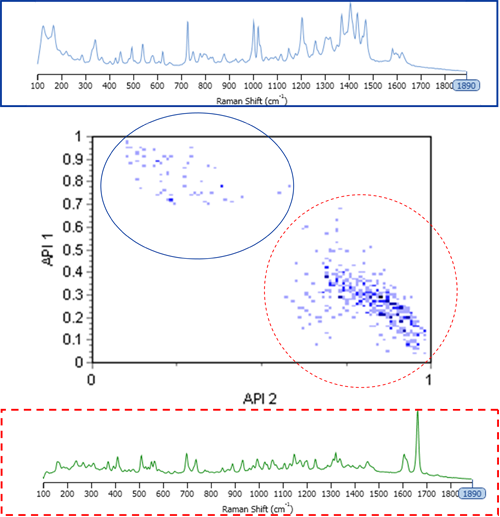
Figure 1 shows a scattergram plot of correlation score results for the two API components in the sample, along with the pure component spectra used to create the library. The scattergram plot allows relationships between different morphological/chemical parameters to be investigated and visualized. The scattergram also imparts statistical information, whereby the darker the region, the more particles are represented.

|
It is clear from Figure 1 that the chemical information allowed differentiation of the two API populations. Therefore, the individual PSDs may be obtained from the blend by setting appropriate classes in the results.
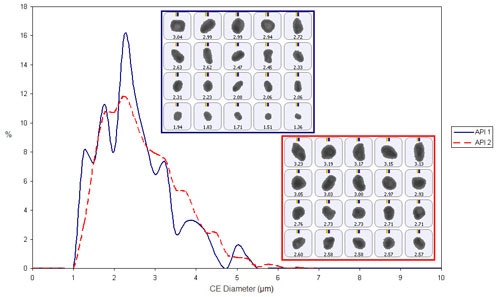
Figure 2 shows the overlay of the circular equivalent diameter (CED) distribution by number of each API from the chemically defined populations. In the sample analyzed there does not appear to be much variation between the particle size of the two APIs.

|
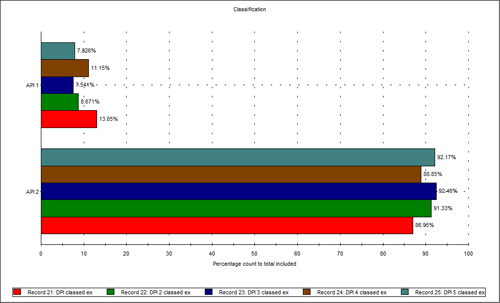
However, when the relative proportion of the APIs was evaluated, a difference was observed. Five repeat measurements were performed and Figure 3 shows the amounts of the two APIs compared by percentage count of particles, after classification based on the chemical information. It was clear that the relative proportion of API 2 present in the samples of the formulation analyzed was higher than that of API 1.

|
The combination of automated particle imaging and Raman spectroscopy in one instrument allows the individual components present within a blend or mixture to be independently characterized and compared. Such a tool can be used to gain a better product understanding across many areas of the pharmaceutical industry from regulatory to troubleshooting. It is not, however, limited to pharmaceuticals alone and is also applicable to other samples which are Raman active.